Kalendarz ekonomiczny Forexu oraz wiadomości ze świata, dostarczane dziennie i tygodniowo

Tygodniowe wiadomości Forexu oraz dokładne światowe wskaźniki ekonomiczne kalendarza z firmy LiteForex

Filtr

Priorytet

KrajPriorytetWydarzeniePoprzedniPrognozaObecny
25.11.2025
03:30
Custom-Based Export Data (Oct) 19,00% 6,10% 5,70%
OpisExports of goods and services consist of transactions in goods and services (sales, barter, gifts or grants) from residents to non-residents. A function of international trade whereby goods produced in one country are shipped to another country for future sale or trade. The sale of such goods addsto the producing nation's gross output. If used for trade, exports are exchangedfor other products or services. Exports are one of the oldest forms of economic transfer, and occur on a large scale between nations that have fewer restrictions on trade, such as tariffs or subsidies.
PriorytetNiski
DataPoprzednia wartośćKolejna wartośćPrzewidywana wartość
2025-10-275.80%19.00%9.00%
2025-09-2411.00%5.80%9.50%
2025-08-2515.50%11.00%9.60%
2025-07-2418.40%15.50%18.70%
2025-06-1810.20%18.40%
2025-05-2617.80%10.20%9.10%
2025-04-2414.00%17.80%13.00%
2025-03-2113.60%14.00%
2025-02-258.70%13.60%7.15%
2025-01-238.20%8.70%8.20%
2024-12-2514.60%8.20%
2024-11-261.10%14.60%5.40%
2024-10-287.00%1.10%2.90%
2024-09-2515.20%7.00%
2024-08-27-0.30%15.20%
2024-07-267.20%-0.30%2.60%
2024-06-216.80%7.20%
2024-05-23-10.90%6.80%
2024-04-293.60%-10.90%-4.50%
2024-03-2610.00%3.60%4.40%
2024-02-234.70%10.00%
2024-01-264.90%4.70%6.00%
2023-12-198.00%4.90%6.30%
2023-11-272.10%8.00%9.30%
2023-10-242.60%2.10%-1.75%
2023-09-26-6.20%2.60%-4.00%
2023-08-25-6.40%-6.20%-0.75%
2023-07-26-4.60%-6.40%-7.30%
2023-06-27-7.60%-4.60%-8.00%
2023-05-30-4.20%-7.60%
2023-04-26-4.70%-4.20%-14.00%
2023-03-30-4.50%-4.70%-6.90%
2023-03-02-14.60%-4.50%-1.00%
2023-01-24-6.00%-14.60%-11.50%
2022-12-27-4.40%-6.00%-5.20%
2022-11-287.80%-4.40%6.00%
2022-10-267.50%7.80%4.20%
2022-09-264.30%7.50%7.70%
2022-08-2611.90%4.30%11.15%
2022-07-2710.50%11.90%8.50%
2022-06-239.90%10.50%6.70%
2022-05-2719.50%9.90%14.60%
2022-04-228.00%19.50%10.20%
2022-03-248.00%8.00%10.20%
2022-03-0124.20%8.00%19.60%
2022-01-2124.70%24.20%15.50%
2021-12-2017.35%24.70%18.00%
2021-11-1817.11%17.35%
2021-10-228.93%17.11%11.62%
2021-09-2420.27%8.93%13.50%
2021-08-2343.82%20.27%19.70%
2021-07-2341.59%43.82%38.98%
2021-06-2413.09%41.59%30.00%
2021-05-258.47%13.09%9.60%
2021-04-23-2.59%8.47%-0.48%
2021-03-250.35%-2.59%-1.50%
2021-02-234.71%0.35%1.85%
2021-01-22-3.65%4.71%-2.40%
2020-12-23-6.71%-3.65%-3.20%
2020-11-23-3.86%-6.71%-6.00%
2020-10-22-7.94%-3.86%-4.08%
2020-09-23-11.37%-7.94%-12.05%
2020-08-24-23.17%-11.37%-17.80%
2020-07-24-22.50%-23.17%-15.50%
2020-06-242.12%-22.50%-6.40%
2020-05-224.17%2.12%-4.60%
2020-04-21-4.47%4.17%-7.00%
2020-03-233.35%-4.47%-7.20%
2020-02-24-1.28%3.35%-2.95%
2020-01-22-7.39%-1.28%-2.05%
2019-12-23-4.54%-7.39%-4.50%
2019-11-21-1.39%-4.54%-3.70%
2019-10-21-4.00%-1.39%-0.60%
2019-09-204.28%-4.00%-2.00%
2019-08-21-2.15%4.28%-2.30%
2019-07-22-5.79%-2.15%-5.00%
2019-06-21-2.57%-5.79%-3.60%
2019-05-22-4.88%-2.57%-2.50%
2019-04-225.91%-4.88%-3.00%
2019-03-21-5.65%5.91%-1.00%
2019-02-22-1.72%-5.65%-1.00%
2019-01-21-0.95%-1.72%0.40%
2018-12-218.70%-0.95%3.26%
2018-11-21-5.20%8.70%4.50%
2018-10-226.68%-5.20%6.05%
2018-09-218.27%6.68%5.00%
2018-08-228.19%8.27%9.80%
2018-07-2011.40%8.19%9.50%
2018-06-2112.34%11.40%9.80%
2018-05-227.06%12.34%11.25%
2018-04-2310.30%7.06%8.00%
2018-03-2117.60%10.30%9.20%
2018-02-218.60%17.60%11.05%
2018-01-2213.40%8.60%10.65%
2017-12-2113.10%13.40%6.40%
2017-11-2212.20%13.10%11.80%
2017-10-1913.20%12.20%10.42%
2017-09-2110.50%13.20%4.93%
2017-08-2311.70%10.50%11.60%
2017-07-2012.70%11.70%7.85%
2017-06-228.50%12.70%6.30%
2017-05-229.20%8.50%11.30%
2017-04-24-2.80%9.20%1.90%
2017-03-228.80%-2.80%-4.00%
2017-02-276.20%8.80%9.85%
2017-01-2410.20%6.20%
2016-12-26-4.20%10.20%1.55%
2016-11-283.40%-4.20%2.15%
2016-10-266.50%3.40%-2.00%
2016-09-26-4.40%6.50%-1.40%
2016-08-26-0.10%-4.40%-2.00%
2016-07-27-4.40%-0.10%-2.02%
2016-06-24-8.00%-4.40%-4.80%
2016-05-251.30%-8.00%-1.25%
2016-04-2510.27%1.30%-4.60%
2016-03-25-8.91%10.27%-7.65%
2016-02-25-8.73%-8.91%-7.10%
2016-01-26-7.42%-8.73%-7.20%
2015-12-28-8.11%-7.42%-5.10%
2015-11-24-5.51%-8.11%-6.95%
2015-10-26-6.69%-5.51%-7.65%
2015-09-28-3.56%-6.69%-3.00%
2015-08-27-7.87%-3.56%-3.85%
2015-07-27-5.01%-7.87%-5.00%
2015-06-26-1.70%-5.01%-2.90%
2015-05-26-4.45%-1.70%-3.20%
2015-04-28-6.14%-4.45%-3.45%
2015-03-26-3.46%-6.14%-3.24%
2015-02-251.90%-3.46%2.55%
2015-01-27-1.00%1.90%0.50%
2014-12-263.97%-1.00%3.46%
2014-11-263.19%3.97%0.35%
2014-10-28-7.40%3.19%-0.25%
2014-09-29-0.85%-7.40%-3.60%
2014-08-013.23%-0.85%
2014-07-01-2.14%3.23%
2014-06-01-1.19%-2.14%
2014-05-01-3.97%-1.19%
2014-04-012.40%-3.97%
2014-03-01-2.20%2.40%
2014-02-011.87%-2.20%
2014-01-01-4.09%1.87%
2013-12-01-0.67%-4.09%
2013-11-01-6.53%-0.67%
2013-10-013.87%-6.53%
2013-09-01-1.51%3.87%
2013-08-01-3.38%-1.51%
2013-07-01-5.27%-3.38%
2013-06-012.97%-5.27%
2013-05-013.60%2.97%
2013-04-01-5.84%3.60%
2013-03-0116.09%-5.84%
2013-02-0113.45%16.09%
2013-01-0126.87%13.45%
2012-12-0115.58%26.87%
2012-11-01-0.47%15.58%
2012-10-01-7.21%-0.47%
2012-09-01-5.41%-7.21%
2012-08-01-2.35%-5.41%
2012-07-0110.17%-2.35%
2012-06-01-2.08%10.17%
2012-05-01-4.85%-2.08%
2012-04-013.72%-4.85%
2012-03-01-2.60%3.72%
2012-02-01-6.05%-2.60%
2012-01-01-11.62%-6.05%
2011-12-01-0.46%-11.62%
2011-11-0115.62%-0.46%
2011-10-0130.09%15.62%
2011-09-0132.36%30.09%
2011-08-0112.81%32.36%
2011-07-0115.49%12.81%
2011-06-0123.59%15.49%
2011-05-0129.34%23.59%
2011-04-0129.15%29.34%
2011-03-0119.78%29.15%
2011-02-0116.15%19.78%
2011-01-0126.54%16.15%
2010-12-0114.56%26.54%
2010-11-0120.38%14.56%
2010-10-0122.87%20.38%
2010-09-0119.76%22.87%
2010-08-0145.53%19.76%
2010-07-0141.20%45.53%
2010-06-0133.95%41.20%
2010-05-0139.98%33.95%
2010-04-0121.54%39.98%
2010-03-0128.61%21.54%
2010-02-0126.00%28.61%
2010-01-0116.70%26.00%
2009-12-01-2.97%16.70%
2009-11-01-8.53%-2.97%
2009-10-01-18.37%-8.53%
2009-09-01-25.70%-18.37%
2009-08-01-25.97%-25.70%
2009-07-01-26.65%-25.97%
2009-06-01-26.10%-26.65%
2009-05-01-23.22%-26.10%
2009-04-01-11.65%-23.22%
2009-03-01-26.49%-11.65%
2009-02-01-14.56%-26.49%
2009-01-01-20.89%-14.56%
2008-12-013.03%-20.89%
2008-11-0120.03%3.03%
2008-10-0115.85%20.03%
2008-09-0145.07%15.85%
2008-08-0130.19%45.07%
2008-07-0124.52%30.19%
2008-06-0130.01%24.52%
2008-05-0116.34%30.01%
2008-04-0118.61%16.34%
2008-03-0136.11%18.61%
2008-02-0121.86%36.11%
2008-01-0126.13%21.86%
2007-12-0129.32%26.13%
2007-11-0112.87%29.32%
2007-10-0118.98%12.87%
2007-09-017.75%18.98%
2007-08-0117.18%7.75%
2007-07-0118.12%17.18%
2007-06-0118.28%18.12%
2007-05-0116.68%18.28%
2007-04-0117.68%16.68%
2007-03-0117.70%17.68%
2007-02-0118.47%17.70%
2007-01-0120.35%18.47%
2006-12-0119.66%20.35%
2006-11-0115.10%19.66%
2006-10-0115.85%15.10%
2006-09-0116.31%15.85%
2006-08-0117.58%16.31%
2006-07-0117.99%17.58%
2006-06-0111.05%17.99%
2006-05-0115.18%11.05%
2006-04-0122.04%15.18%
2006-03-0113.40%22.04%
2006-02-0111.25%13.40%
2006-01-0114.47%11.25%
2005-12-018.43%14.47%
2005-11-0122.74%8.43%
2005-10-0125.01%22.74%
2005-09-0118.49%25.01%
2005-08-0111.97%18.49%
2005-07-0114.85%11.97%
2005-06-0114.02%14.85%
2005-05-0120.87%14.02%
2005-04-015.85%20.87%
2005-03-0110.57%5.85%
2005-02-0116.73%10.57%
2005-01-0119.13%16.73%
2004-12-0119.08%19.13%
2004-11-0119.90%19.08%
2004-10-0125.66%19.90%
2004-09-0124.21%25.66%
2004-08-0125.85%24.21%
2004-07-0118.06%25.85%
2004-06-0121.51%18.06%
2004-05-0120.20%21.51%
2004-04-0121.05%20.20%
2004-03-0116.20%21.05%
2004-02-0130.66%16.20%
2004-01-0116.31%30.66%
2003-12-0117.43%16.31%
2003-11-0112.98%17.43%
2003-10-015.44%12.98%
2003-09-0116.55%5.44%
2003-08-0112.94%16.55%
2003-07-0113.70%12.94%
2003-06-0121.39%13.70%
2003-05-0116.24%21.39%
2003-04-0124.68%16.24%
2003-03-0125.86%24.68%
2003-02-0110.16%25.86%
2003-01-0113.96%10.16%
2002-12-0116.18%13.96%
2002-11-0114.45%16.18%
2002-10-017.13%14.45%
2002-09-014.69%7.13%
2002-08-014.94%4.69%
2002-07-013.13%4.94%
2002-06-010.38%3.13%
2002-05-01-6.24%0.38%
2002-04-01-7.56%-6.24%
2002-03-01-6.36%-7.56%
2002-02-01-14.93%-6.36%
2002-01-01-12.52%-14.93%
2001-12-01-13.84%-12.52%
2001-11-01-9.82%-13.84%
2001-10-01-8.55%-9.82%
2001-09-01-13.27%-8.55%
2001-08-01-0.28%-13.27%
2001-07-018.52%-0.28%
2001-06-01-6.77%8.52%
2001-05-013.89%-6.77%
2001-04-01-3.83%3.89%
2001-03-01-3.77%-3.83%
2001-02-0110.74%-3.77%
2001-01-0116.33%10.74%
2000-12-0115.18%16.33%
2000-11-0117.75%15.18%
03:30
Custom-Based Import Data (Oct) 17,20% 7,50% 16,30%
OpisImports of goods and services consist of transactions in goods and services (purchases, barter, gifts or grants) from non-residents to residents. A good or service brought into one country from another. Along with exports, imports form the backbone of international trade. The higher the value of imports entering a country, compared to the value of exports, the more negative that country's balance of trade becomes.
PriorytetNiski
DataPoprzednia wartośćKolejna wartośćPrzewidywana wartość
2025-10-2715.80%17.20%10.60%
2025-09-245.10%15.80%9.30%
2025-08-2513.10%5.10%4.90%
2025-07-2418.00%13.10%17.75%
2025-06-1816.10%18.00%
2025-05-2610.20%16.10%7.00%
2025-04-244.00%10.20%6.35%
2025-03-217.90%4.00%
2025-02-2514.90%7.90%2.95%
2025-01-230.90%14.90%13.70%
2024-12-2515.90%0.90%
2024-11-269.90%15.90%6.40%
2024-10-288.90%9.90%6.00%
2024-09-2513.10%8.90%
2024-08-270.30%13.10%
2024-07-26-1.70%0.30%3.00%
2024-06-218.30%-1.70%
2024-05-235.60%8.30%
2024-04-293.20%5.60%4.55%
2024-03-262.60%3.20%1.50%
2024-02-23-3.10%2.60%
2024-01-2610.10%-3.10%7.20%
2023-12-1910.20%10.10%3.00%
2023-11-27-8.30%10.20%6.00%
2023-10-24-12.80%-8.30%-5.55%
2023-09-26-11.10%-12.80%-10.00%
2023-08-25-10.30%-11.10%-8.10%
2023-07-26-3.40%-10.30%-7.25%
2023-06-27-7.30%-3.40%-9.90%
2023-05-30-7.10%-7.30%
2023-04-261.10%-7.10%-4.70%
2023-03-305.50%1.10%2.10%
2023-03-02-12.00%5.50%-3.40%
2023-01-245.60%-12.00%-8.00%
2022-12-27-2.10%5.60%-0.80%
2022-11-2815.60%-2.10%10.00%
2022-10-2621.30%15.60%20.00%
2022-09-2623.90%21.30%17.90%
2022-08-2624.50%23.90%22.60%
2022-07-2724.10%24.50%20.60%
2022-06-2321.50%24.10%17.30%
2022-05-2718.00%21.50%16.40%
2022-04-2216.80%18.00%8.90%
2022-03-2420.50%16.80%19.00%
2022-03-0133.40%20.50%22.15%
2022-01-2120.50%33.40%18.15%
2021-12-2034.64%20.50%23.00%
2021-11-1830.31%34.64%
2021-10-2247.92%30.31%33.10%
2021-09-2445.94%47.92%40.35%
2021-08-2353.75%45.94%43.00%
2021-07-2363.54%53.75%46.30%
2021-06-2429.79%63.54%53.65%
2021-05-2514.12%29.79%25.10%
2021-04-2321.99%14.12%5.95%
2021-03-25-5.24%21.99%11.15%
2021-02-233.62%-5.24%-8.30%
2021-01-22-0.99%3.62%-2.05%
2020-12-23-14.32%-0.99%-9.00%
2020-11-23-9.08%-14.32%-13.40%
2020-10-22-19.68%-9.08%-16.25%
2020-09-23-26.38%-19.68%-19.30%
2020-08-24-18.05%-26.38%-23.20%
2020-07-24-34.41%-18.05%-16.70%
2020-06-24-17.13%-34.41%-18.00%
2020-05-227.25%-17.13%-14.25%
2020-04-21-4.30%7.25%-10.00%
2020-03-23-7.86%-4.30%-5.70%
2020-02-242.54%-7.86%-13.80%
2020-01-22-13.78%2.54%2.20%
2019-12-23-7.57%-13.78%-6.80%
2019-11-21-4.24%-7.57%-6.60%
2019-10-21-14.62%-4.24%-5.00%
2019-09-201.67%-14.62%-4.75%
2019-08-21-9.44%1.67%-5.40%
2019-07-22-0.64%-9.44%-2.96%
2019-06-21-0.72%-0.64%-1.90%
2019-05-22-7.63%-0.72%-4.60%
2019-04-22-10.03%-7.63%-2.95%
2019-03-2113.99%-10.03%3.35%
2019-02-22-8.15%13.99%-1.00%
2019-01-2114.66%-8.15%3.87%
2018-12-2111.23%14.66%8.34%
2018-11-219.90%11.23%6.80%
2018-10-2222.80%9.90%14.24%
2018-09-2110.53%22.80%11.10%
2018-08-2210.83%10.53%10.05%
2018-07-2011.72%10.83%14.27%
2018-06-2120.36%11.72%14.95%
2018-05-229.47%20.36%13.35%
2018-04-2316.00%9.47%11.60%
2018-03-2124.30%16.00%15.35%
2018-02-2116.60%24.30%15.00%
2018-01-2213.70%16.60%10.35%
2017-12-2113.50%13.70%12.80%
2017-11-229.73%13.50%6.70%
2017-10-1914.90%9.73%11.44%
2017-09-2118.50%14.90%14.75%
2017-08-2313.70%18.50%13.00%
2017-07-2018.30%13.70%11.20%
2017-06-2213.40%18.30%10.70%
2017-05-2219.30%13.40%17.00%
2017-04-2420.40%19.30%9.55%
2017-03-225.17%20.40%12.60%
2017-02-2710.30%5.17%11.90%
2017-01-243.00%10.30%
2016-12-266.50%3.00%-1.05%
2016-11-285.60%6.50%3.60%
2016-10-26-1.50%5.60%0.70%
2016-09-26-7.20%-1.50%-4.25%
2016-08-26-10.10%-7.20%-6.00%
2016-07-270.50%-10.10%-8.95%
2016-06-24-14.92%0.50%-5.45%
2016-05-25-6.94%-14.92%-7.65%
2016-04-25-16.82%-6.94%-11.65%
2016-03-25-12.37%-16.82%-8.60%
2016-02-25-9.23%-12.37%-9.75%
2016-01-26-9.53%-9.23%-5.05%
2015-12-28-18.21%-9.53%-14.50%
2015-11-24-26.20%-18.21%-16.03%
2015-10-26-4.77%-26.20%-19.10%
2015-09-28-12.73%-4.77%-2.50%
2015-08-27-0.21%-12.73%-12.00%
2015-07-27-19.97%-0.21%-7.70%
2015-06-26-6.84%-19.97%-9.00%
2015-05-26-5.89%-6.84%-6.80%
2015-04-281.47%-5.89%0.25%
2015-03-26-13.33%1.47%-1.00%
2015-02-25-8.74%-13.33%-14.10%
2015-01-27-3.46%-8.74%-2.45%
2014-12-26-4.88%-3.46%2.29%
2014-11-2614.42%-4.88%-3.30%
2014-10-28-14.17%14.42%-6.90%
2014-09-29-2.86%-14.17%-2.85%
2014-08-01-14.03%-2.86%
2014-07-01-9.32%-14.03%
2014-06-01-14.54%-9.32%
2014-05-01-14.19%-14.54%
2014-04-01-16.62%-14.19%
2014-03-01-15.50%-16.62%
2014-02-01-9.30%-15.50%
2014-01-01-4.66%-9.30%
2013-12-01-5.37%-4.66%
2013-11-01-4.50%-5.37%
2013-10-01-1.24%-4.50%
2013-09-01-2.52%-1.24%
2013-08-012.92%-2.52%
2013-07-01-2.85%2.92%
2013-06-019.00%-2.85%
2013-05-01-13.64%9.00%
2013-04-017.56%-13.64%
2013-03-0143.36%7.56%
2013-02-016.28%43.36%
2013-01-0120.07%6.28%
2012-12-0123.65%20.07%
2012-11-01-6.61%23.65%
2012-10-01-7.80%-6.61%
2012-09-0112.80%-7.80%
2012-08-013.01%12.80%
2012-07-0119.58%3.01%
2012-06-019.45%19.58%
2012-05-0128.09%9.45%
2012-04-018.24%28.09%
2012-03-01-4.21%8.24%
2012-02-0121.64%-4.21%
2012-01-01-2.43%21.64%
2011-12-0120.75%-2.43%
2011-11-0141.90%20.75%
2011-10-0144.07%41.90%
2011-09-0113.45%44.07%
2011-08-0126.12%13.45%
2011-07-0133.75%26.12%
2011-06-0126.13%33.75%
2011-05-0125.74%26.13%
2011-04-0122.17%25.74%
2011-03-0133.30%22.17%
2011-02-0111.43%33.30%
2011-01-0135.30%11.43%
2010-12-0114.78%35.30%
2010-11-0116.00%14.78%
2010-10-0141.11%16.00%
2010-09-0136.02%41.11%
2010-08-0137.77%36.02%
2010-07-0155.02%37.77%
2010-06-0148.24%55.02%
2010-05-0163.77%48.24%
2010-04-0171.53%63.77%
2010-03-0144.82%71.53%
2010-02-0128.18%44.82%
2010-01-01-2.23%28.18%
2009-12-01-17.54%-2.23%
2009-11-01-17.86%-17.54%
2009-10-01-32.80%-17.86%
2009-09-01-32.90%-32.80%
2009-08-01-29.27%-32.90%
2009-07-01-34.70%-29.27%
2009-06-01-36.46%-34.70%
2009-05-01-35.13%-36.46%
2009-04-01-40.34%-35.13%
2009-03-01-37.60%-40.34%
2009-02-01-6.53%-37.60%
2009-01-012.01%-6.53%
2008-12-0121.69%2.01%
2008-11-0139.36%21.69%
2008-10-0126.85%39.36%
2008-09-0155.88%26.85%
2008-08-0134.63%55.88%
2008-07-0115.68%34.63%
2008-06-0143.18%15.68%
2008-05-0132.40%43.18%
2008-04-0133.29%32.40%
2008-03-0149.07%33.29%
2008-02-018.84%49.07%
2008-01-0117.41%8.84%
2007-12-0120.15%17.41%
2007-11-017.19%20.15%
2007-10-0113.98%7.19%
2007-09-012.44%13.98%
2007-08-015.13%2.44%
2007-07-016.68%5.13%
2007-06-0110.58%6.68%
2007-05-012.15%10.58%
2007-04-014.69%2.15%
2007-03-014.41%4.69%
2007-02-0115.79%4.41%
2007-01-0111.54%15.79%
2006-12-0110.96%11.54%
2006-11-018.92%10.96%
2006-10-0113.41%8.92%
2006-09-0117.92%13.41%
2006-08-013.04%17.92%
2006-07-016.34%3.04%
2006-06-010.32%6.34%
2006-05-011.31%0.32%
2006-04-0119.03%1.31%
2006-03-012.00%19.03%
2006-02-0127.44%2.00%
2006-01-0114.75%27.44%
2005-12-0118.78%14.75%
2005-11-0120.62%18.78%
2005-10-0121.65%20.62%
2005-09-0120.26%21.65%
2005-08-0136.10%20.26%
2005-07-0137.13%36.10%
2005-06-0129.07%37.13%
2005-05-0129.09%29.07%
2005-04-0122.13%29.09%
2005-03-0132.80%22.13%
2005-02-012.36%32.80%
2005-01-0129.26%2.36%
2004-12-0117.59%29.26%
2004-11-0126.43%17.59%
2004-10-0132.90%26.43%
2004-09-0123.26%32.90%
2004-08-0139.50%23.26%
2004-07-0131.43%39.50%
2004-06-0130.12%31.43%
2004-05-0134.89%30.12%
2004-04-0124.81%34.89%
2004-03-0117.19%24.81%
2004-02-0144.54%17.19%
2004-01-0112.91%44.54%
2003-12-0120.45%12.91%
2003-11-0115.74%20.45%
2003-10-016.35%15.74%
2003-09-0112.58%6.35%
2003-08-019.48%12.58%
2003-07-0113.40%9.48%
2003-06-0112.12%13.40%
2003-05-0115.89%12.12%
2003-04-0123.94%15.89%
2003-03-0118.37%23.94%
2003-02-0115.36%18.37%
2003-01-0115.28%15.36%
2002-12-0114.69%15.28%
2002-11-018.51%14.69%
2002-10-0115.70%8.51%
2002-09-015.39%15.70%
2002-08-019.70%5.39%
2002-07-01-0.87%9.70%
2002-06-015.04%-0.87%
2002-05-01-8.56%5.04%
2002-04-01-16.28%-8.56%
2002-03-01-10.05%-16.28%
2002-02-01-15.47%-10.05%
2002-01-01-11.14%-15.47%
2001-12-01-15.63%-11.14%
2001-11-01-6.22%-15.63%
2001-10-01-12.39%-6.22%
2001-09-013.76%-12.39%
2001-08-01-11.47%3.76%
2001-07-0113.34%-11.47%
2001-06-013.40%13.34%
2001-05-0120.88%3.40%
2001-04-014.28%20.88%
2001-03-0134.86%4.28%
2001-02-016.60%34.86%
2001-01-0119.35%6.60%
2000-12-0135.23%19.35%
2000-11-0122.26%35.23%
03:30
Custom-Based Trade Data (USD) (Oct) 1,280B -0,650B -3,440B
OpisTrade balance is the net difference between exports and imports collected from the import/export entry forms of the Customs Department, which reveal both volume and value of imports and exports. In order for the trade balance to be consistent with the definition of balance of payments, statistical modifications have been made to exclude some customs items for the transactions carried out among the residents. Such items include: goods granted embassy privilege; goods with no change of ownership, e.g., goods sent for repair, temporary imported goods, sample goods, leased goods. Adjustments are as well made to include goods actually imported and exported but did not undergo customs declaration such as military goods, electrical appliances and commercial aircrafts.
PriorytetNiski
DataPoprzednia wartośćKolejna wartośćPrzewidywana wartość
2025-10-27-1.960B1.280B0.350B
2025-09-240.320B-1.960B0.680B
2025-08-251.060B0.320B-0.500B
2025-07-241.120B1.060B0.600B
2025-06-18-3.300B1.120B
2025-05-260.970B-3.300B-1.200B
2025-04-242.000B0.970B1.000B
2025-03-21-1.880B2.000B
2025-02-25-0.010B-1.880B-1.900B
2025-01-23-0.220B-0.010B0.290B
2024-12-25-0.790B-0.220B
2024-11-260.390B-0.790B-0.500B
2024-10-280.260B0.390B1.540B
2024-09-25-1.370B0.260B
2024-08-270.220B-1.370B
2024-07-260.660B0.220B0.600B
2024-06-21-1.640B0.660B
2024-05-23-1.160B-1.640B
2024-04-29-0.550B-1.160B0.820B
2024-03-26-2.760B-0.550B-0.560B
2024-02-230.970B-2.760B
2024-01-26-2.400B0.970B-1.370B
2023-12-19-0.830B-2.400B-0.550B
2023-11-272.100B-0.830B0.530B
2023-10-240.360B2.100B0.490B
2023-09-26-1.980B0.360B-1.750B
2023-08-250.060B-1.980B-1.300B
2023-07-26-1.800B0.060B-0.900B
2023-06-27-1.470B-1.800B-0.300B
2023-05-302.720B-1.470B
2023-04-26-1.110B2.720B-1.070B
2023-03-30-4.650B-1.110B-1.450B
2023-03-02-1.030B-4.650B-1.400B
2023-01-24-1.340B-1.030B-1.060B
2022-12-27-0.600B-1.340B-0.200B
2022-11-28-0.850B-0.600B-1.150B
2022-10-26-4.200B-0.850B-2.900B
2022-09-26-3.660B-4.200B-3.150B
2022-08-26-1.530B-3.660B-1.600B
2022-07-27-1.870B-1.530B-1.530B
2022-06-23-1.910B-1.870B-1.280B
2022-05-271.460B-1.910B
2022-04-220.120B1.460B-0.150B
2022-03-24-2.500B0.120B-1.500B
2022-03-01-0.350B-2.500B-0.300B
2022-01-211.020B-0.350B0.470B
2021-12-20-0.370B1.020B-0.260B
2021-11-180.610B-0.370B
2021-10-22-1.220B0.610B-0.800B
2021-09-240.180B-1.220B0.970B
2021-08-230.950B0.180B0.940B
2021-07-230.800B0.950B1.130B
2021-06-240.180B0.800B0.780B
2021-05-250.710B0.180B-0.170B
2021-04-230.010B0.710B0.600B
2021-03-25-0.200B0.010B1.550B
2021-02-230.960B-0.200B0.070B
2021-01-220.050B0.960B0.580B
2020-12-232.050B0.050B1.600B
2020-11-232.230B2.050B1.940B
2020-10-224.350B2.230B3.550B
2020-09-233.340B4.350B3.450B
2020-08-241.610B3.340B1.170B
2020-07-242.690B1.610B3.130B
2020-06-242.460B2.690B2.740B
2020-05-221.590B2.460B0.410B
2020-04-213.900B1.590B2.800B
2020-03-23-1.560B3.900B2.600B
2020-02-240.600B-1.560B-0.800B
2020-01-220.550B0.600B0.630B
2019-12-230.510B0.550B-0.190B
2019-11-211.280B0.510B0.400B
2019-10-212.050B1.280B2.140B
2019-09-200.110B2.050B0.450B
2019-08-213.210B0.110B0.540B
2019-07-220.180B3.210B0.830B
2019-06-21-1.460B0.180B0.580B
2019-05-222.000B-1.460B-0.490B
2019-04-224.030B2.000B1.280B
2019-03-21-4.030B4.030B0.140B
2019-02-221.060B-4.030B0.320B
2019-01-21-1.180B1.060B-1.100B
2018-12-21-0.280B-1.180B0.870B
2018-11-210.490B-0.280B-0.190B
2018-10-22-0.590B0.490B1.610B
2018-09-21-0.520B-0.590B1.190B
2018-08-221.580B-0.520B0.150B
2018-07-201.200B1.580B1.280B
2018-06-21-1.280B1.200B0.040B
2018-05-221.270B-1.280B-0.120B
2018-04-230.810B1.270B0.700B
2018-03-21-0.120B0.810B0.800B
2018-02-21-0.280B-0.120B0.330B
2018-01-221.760B-0.280B1.100B
2017-12-210.210B1.760B0.720B
2017-11-223.350B0.210B1.300B
2017-10-192.090B3.350B2.550B
2017-09-21-0.190B2.090B0.520B
2017-08-231.920B-0.190B0.800B
2017-07-200.940B1.920B1.320B
2017-06-220.060B0.940B1.160B
2017-05-221.620B0.060B0.300B
2017-04-241.610B1.620B1.720B
2017-03-220.830B1.610B2.400B
2017-02-270.940B0.830B0.120B
2017-01-241.540B0.940B
2016-12-260.250B1.540B0.500B
2016-11-282.550B0.250B1.900B
2016-10-262.130B2.550B2.270B
2016-09-261.210B2.130B1.220B
2016-08-261.970B1.210B1.400B
2016-07-271.540B1.970B1.320B
2016-06-240.720B1.540B2.500B
2016-05-252.970B0.720B0.500B
2016-04-254.990B2.970B2.950B
2016-03-250.240B4.990B0.710B
2016-02-251.490B0.240B0.220B
2016-01-260.300B1.490B1.010B
2015-12-282.100B0.300B1.740B
2015-11-242.790B2.100B1.650B
2015-10-260.720B2.790B0.700B
2015-09-280.770B0.720B1.120B
2015-08-270.150B0.770B0.380B
2015-07-272.420B0.150B2.000B
2015-06-26-0.520B2.420B0.500B
2015-05-261.500B-0.520B-0.780B
2015-04-280.390B1.500B0.540B
2015-03-26-0.460B0.390B1.580B
2015-02-251.590B-0.460B0.840B
2015-01-27-0.080B1.590B0.100B
2014-12-260.030B-0.080B-0.370B
2014-11-26-1.800B0.030B-0.882B
2014-10-281.150B-1.800B1.200B
2014-09-29-1.100B1.150B-0.300B
2014-08-011.66B-1.100B
2014-07-01-0.81B1.66B
2014-06-01-1.51B-0.81B
2014-05-011.29B-1.51B
2014-04-011.76B1.29B
2014-03-01-2.56B1.76B
2014-02-01-0.41B-2.56B
2014-01-01-0.56B-0.41B
2013-12-01-1.77B-0.56B
2013-11-010.32B-1.77B
2013-10-01-0.28B0.32B
2013-09-01-1.53B-0.28B
2013-08-01-1.90B-1.53B
2013-07-01-2.46B-1.90B
2013-06-01-4.48B-2.46B
2013-05-01-0.95B-4.48B
2013-04-01-1.98B-0.95B
2013-03-01-5.91B-1.98B
2013-02-01-2.68B-5.91B
2013-01-01-0.70B-2.68B
2012-12-01-2.84B-0.70B
2012-11-010.78B-2.84B
2012-10-01-1.30B0.78B
2012-09-01-1.77B-1.30B
2012-08-01-0.63B-1.77B
2012-07-01-2.01B-0.63B
2012-06-01-3.18B-2.01B
2012-05-01-5.07B-3.18B
2012-04-010.53B-5.07B
2012-03-01-1.13B0.53B
2012-02-01-3.60B-1.13B
2012-01-01-1.46B-3.60B
2011-12-01-1.19B-1.46B
2011-11-01-0.53B-1.19B
2011-10-01-1.55B-0.53B
2011-09-011.74B-1.55B
2011-08-010.44B1.74B
2011-07-01-0.19B0.44B
2011-06-01-1.09B-0.19B
2011-05-011.41B-1.09B
2011-04-011.26B1.41B
2011-03-01-1.45B1.26B
2011-02-010.91B-1.45B
2011-01-010.15B0.91B
2010-12-011.99B0.15B
2010-11-012.95B1.99B
2010-10-010.51B2.95B
2010-09-01-1.04B0.51B
2010-08-012.24B-1.04B
2010-07-012.11B2.24B
2010-06-01-0.58B2.11B
2010-05-010.66B-0.58B
2010-04-010.22B0.66B
2010-03-010.28B0.22B
2010-02-010.19B0.28B
2010-01-011.00B0.19B
2009-12-011.76B1.00B
2009-11-011.98B1.76B
2009-10-012.08B1.98B
2009-09-010.78B2.08B
2009-08-010.93B0.78B
2009-07-012.40B0.93B
2009-06-010.61B2.40B
2009-05-012.08B0.61B
2009-04-013.54B2.08B
2009-03-011.37B3.54B
2009-02-010.35B1.37B
2009-01-01-1.26B0.35B
2008-12-01-0.56B-1.26B
2008-11-010.56B-0.56B
2008-10-01-0.40B0.56B
2008-09-01-0.71B-0.40B
2008-08-010.54B-0.71B
2008-07-011.71B0.54B
2008-06-01-1.33B1.71B
2008-05-010.45B-1.33B
2008-04-01-0.44B0.45B
2008-03-01-0.35B-0.44B
2008-02-011.54B-0.35B
2008-01-012.11B1.54B
2007-12-011.81B2.11B
2007-11-012.28B1.81B
2007-10-010.90B2.28B
2007-09-010.38B0.90B
2007-08-010.82B0.38B
2007-07-010.51B0.82B
2007-06-010.07B0.51B
2007-05-011.90B0.07B
2007-04-010.90B1.90B
2007-03-010.68B0.90B
2007-02-010.08B0.68B
2007-01-010.92B0.08B
2006-12-010.63B0.92B
2006-11-011.49B0.63B
2006-10-010.27B1.49B
2006-09-01-0.21B0.27B
2006-08-01-0.47B-0.21B
2006-07-01-0.68B-0.47B
2006-06-01-0.58B-0.68B
2006-05-010.29B-0.58B
2006-04-01-0.32B0.29B
2006-03-01-0.48B-0.32B
2006-02-01-0.15B-0.48B
2006-01-010.05B-0.15B
2005-12-01-0.18B0.05B
2005-11-010.78B-0.18B
2005-10-010.02B0.78B
2005-09-01-0.05B0.02B
2005-08-01-1.76B-0.05B
2005-07-01-1.65B-1.76B
2005-06-01-1.46B-1.65B
2005-05-01-1.03B-1.46B
2005-04-01-0.46B-1.03B
2005-03-01-1.35B-0.46B
2005-02-010.96B-1.35B
2005-01-010.06B0.96B
2004-12-010.62B0.06B
2004-11-010.50B0.62B
2004-10-01-0.21B0.50B
2004-09-010.08B-0.21B
2004-08-010.17B0.08B
2004-07-010.09B0.17B
2004-06-01-0.29B0.09B
2004-05-01-0.29B-0.29B
2004-04-010.60B-0.29B
2004-03-010.17B0.60B
2004-02-01-0.08B0.17B
2004-01-010.61B-0.08B
2003-12-010.43B0.61B
2003-11-010.76B0.43B
2003-10-010.20B0.76B
2003-09-010.02B0.20B
2003-08-010.77B0.02B
2003-07-010.76B0.77B
2003-06-010.17B0.76B
2003-05-010.50B0.17B
2003-04-010.66B0.50B
2003-03-010.20B0.66B
2003-02-010.48B0.20B
2003-01-010.36B0.48B
2002-12-010.52B0.36B
2002-11-010.81B0.52B
2002-10-010.24B0.81B
2002-09-01-0.18B0.24B
2002-08-010.52B-0.18B
2002-07-010.65B0.52B
2002-06-01-0.25B0.65B
2002-05-010.42B-0.25B
2002-04-010.51B0.42B
2002-03-01-0.14B0.51B
2002-02-010.64B-0.14B
2002-01-010.37B0.64B
2001-12-010.38B0.37B
2001-11-010.44B0.38B
2001-10-010.63B0.44B
2001-09-01-0.14B0.63B
2001-08-010.71B-0.14B
2001-07-010.43B0.71B
2001-06-01-0.02B0.43B
2001-05-010.30B-0.02B
2001-04-010.06B0.30B
2001-03-01-0.37B0.06B
2001-02-010.72B-0.37B
2001-01-010.51B0.72B
2000-12-010.32B0.51B
2000-11-010.71B0.32B
05:00
Car Registration (MoM) (Oct) 277,4%   -53,7%
OpisThe car registrations published by the European Automobile Manufacturers’ Association (ACEA) describe the number of new passenger car registrations in the United Kingdom. If the number increases, this is a sign of increasing consumption. At the same time, British carmakers are earning more money, leading to rising profits. This generally boosts the economy - and vice versa. If car registrations are higher than expected, this usually leads to a rising pound (GBP) exchange rate on the currency markets. Conversely, the pound exchange rate (GBP) falls if new registrations are lower than expected or if expectations are missed.
PriorytetNiski
DataPoprzednia wartośćKolejna wartośćPrzewidywana wartość
2025-10-28-40.8%277.4%
2025-09-25-26.7%-40.8%
2025-08-2827.5%-26.7%
2025-07-2424.7%27.5%
2025-06-25-66.3%24.7%
2025-05-27324.8%-66.3%
2025-04-24-39.7%324.8%
2025-03-25-1.0%-39.7%
2025-02-25-8.3%-1.0%
2025-01-216.5%-8.3%
2024-12-19-47.6%6.5%
2024-11-21225.4%-47.6%
2024-10-22-42.7%225.4%
2024-09-19-17.7%-42.7%
2024-08-2921.4%-17.7%
2024-07-1810.0%21.4%
2024-06-20-57.7%10.0%
2024-05-22274.4%-57.7%
2024-04-18-40.6%274.4%
2024-03-211.3%-40.6%
2024-02-20-9.9%1.3%
2024-01-182.0%-9.9%
2023-12-20-43.7%2.0%
2023-11-21218.3%-43.7%
2023-11-06218.3%218.3%
2023-10-20-40.5%218.3%
2023-09-20-18.8%-40.5%
2023-08-3022.1%-18.8%
2023-07-199.2%22.1%
2023-06-21-53.8%9.2%
2023-05-17286.6%-53.8%
2023-04-19-43.6%286.6%
2023-03-212.7%-43.6%
2023-02-21-10.1%2.7%
2023-01-186.4%-10.1%
2022-12-15-40.4%6.4%
2022-11-17227.2%-40.4%
2022-10-18-38.6%227.2%
2022-09-1613.3%-38.6%
2022-07-154.4%13.3%
2022-06-16-51.1%4.4%
2022-05-18312.7%-51.1%
2022-04-20-48.7%312.7%
2022-03-176.0%-48.7%
2022-02-17-6.1%6.0%
2022-01-188.9%-6.1%
2021-12-17-50.6%8.9%
2021-11-18216.5%-50.6%
2021-10-15-33.8%216.5%
2021-09-16-33.8%-33.8%
2021-08-1618.8%-33.8%
2021-07-1610.7%18.8%
2021-06-17-50.1%10.7%
2021-05-19453.4%-50.1%
2021-04-16-43.1%453.4%
2021-04-06-43.1%-43.1%
2021-03-17-32.0%-43.1%
2021-02-1716.6%-32.0%
2021-01-19-19.3%16.6%
2021-01-06-19.3%-19.3%
2020-12-17-57.0%-19.3%
2020-11-18276.1%-57.0%
2020-10-16-50.1%276.1%
2020-10-05-50.1%-50.1%
2020-09-17618.0%-50.1%
2020-09-0420.3%618.0%
2020-08-05618.0%20.3%
2020-07-04368.6%618.0%
2020-06-04-98.3%368.6%
2020-05-19220.0%-98.3%
2020-04-17-46.7%220.0%
2020-03-180.2%-46.7%
2020-02-18-4.9%0.2%
2020-01-169.3%-4.9%
2019-12-17-58.3%9.3%
2019-11-19270.8%-58.3%
2019-10-16-41.1%270.8%
2019-09-180-41.1%
05:00
Car Registration (YoY) (Oct) 13,7%   0,5%
OpisThe car registrations published by the European Automobile Manufacturers’ Association (ACEA) describe the number of new passenger car registrations in the United Kingdom. If the number increases, this is a sign of increasing consumption. At the same time, British carmakers are earning more money, leading to rising profits. This generally boosts the economy - and vice versa. If car registrations are higher than expected, this usually leads to a rising pound (GBP) exchange rate on the currency markets. Conversely, the pound exchange rate (GBP) falls if new registrations are lower than expected or if expectations are missed.
PriorytetNiski
DataPoprzednia wartośćKolejna wartośćPrzewidywana wartość
2025-10-28-2.0%13.7%
2025-10-06-2.0%-2.0%
2025-09-25-2.0%-2.0%
2025-09-04-5.0%-2.0%
2025-08-286.7%-5.0%
2025-08-056.7%6.7%
2025-07-241.6%6.7%
2025-07-041.6%1.6%
2025-06-25-10.4%1.6%
2025-06-05-10.4%-10.4%
2025-05-2712.4%-10.4%
2025-05-0612.4%12.4%
2025-04-24-1.0%12.4%
2025-04-04-1.0%-1.0%
2025-03-25-2.5%-1.0%
2025-03-05-2.5%-2.5%
2025-02-25-0.2%-2.5%
2025-01-21-1.9%-0.2%
2025-01-06-1.9%-1.9%
2024-12-19-6.0%-1.9%
2024-11-211.0%-6.0%
2024-11-051.0%1.0%
2024-10-22-1.3%1.0%
2024-10-04-1.3%-1.3%
2024-09-192.5%-1.3%
2024-08-291.1%2.5%
2024-07-181.7%1.1%
2024-07-041.7%1.7%
2024-06-201.0%1.7%
2024-06-051.0%1.0%
2024-05-2210.4%1.0%
2024-05-0710.4%10.4%
2024-04-1814.0%10.4%
2024-03-218.2%14.0%
2024-02-209.8%8.2%
2024-02-059.8%9.8%
2024-01-189.5%9.8%
2024-01-059.5%9.5%
2023-12-2014.3%9.5%
2023-11-2121.0%14.3%
2023-11-0621.0%21.0%
2023-10-2024.4%21.0%
2023-09-2028.3%24.4%
2023-08-3025.8%28.3%
2023-07-1916.7%25.8%
2023-06-2111.6%16.7%
2023-05-1718.2%11.6%
2023-04-1926.2%18.2%
2023-03-2114.7%26.2%
2023-02-2118.3%14.7%
2023-01-1823.5%18.3%
2022-12-1526.4%23.5%
2022-11-174.6%26.4%
2022-10-181.2%4.6%
2022-09-16-24.3%1.2%
2022-07-15-20.6%-24.3%
2022-06-16-15.8%-20.6%
2022-05-18-14.3%-15.8%
2022-04-2015.0%-14.3%
2022-03-1727.5%15.0%
2022-02-17-18.2%27.5%
2022-01-181.7%-18.2%
2021-12-17-24.6%1.7%
2021-11-18-34.4%-24.6%
2021-10-15-22.0%-34.4%
2021-09-16-29.5%-22.0%
2021-08-1628.0%-29.5%
2021-07-16674.1%28.0%
2021-07-05674.1%674.1%
2021-06-173,176.6%674.1%
2021-05-1911.5%3,176.6%
2021-04-16-35.5%11.5%
2021-04-06-35.5%-35.5%
2021-03-17-39.5%-35.5%
2021-02-17-10.9%-39.5%
2021-01-19-27.4%-10.9%
2021-01-06-27.4%-27.4%
2020-12-17-1.6%-27.4%
2020-11-18-4.4%-1.6%
2020-10-16-5.8%-4.4%
2020-10-05-5.8%-5.8%
2020-09-17-34.9%-5.8%
2020-09-0411.3%-34.9%
2020-08-04-34.9%11.3%
2020-07-04-89.0%-34.9%
2020-06-04-97.3%-89.0%
2020-05-19-44.4%-97.3%
2020-04-17-2.9%-44.4%
2020-03-18-7.3%-2.9%
2020-02-183.4%-7.3%
2020-01-16-1.3%3.4%
2019-12-17-6.7%-1.3%
2019-11-191.3%-6.7%
2019-10-16-1.6%1.3%
2019-09-180-1.6%
05:00
Italian Car Registration (MoM) (Oct) 88,4%   -0,7%
OpisThe car registrations published by the European Automobile Manufacturers’ Association (ACEA) describe the number of new passenger car registrations in Italy. If the number increases, this is a sign of increasing consumption. At the same time, Italian carmakers are earning more money, leading to rising profits. This generally boosts the economy - and vice versa. If car registrations are higher than expected, this usually leads to a rising euro (EUR) exchange rate on the currency markets. Conversely, the euro exchange rate (EUR) falls if new registrations are lower than expected or if expectations are missed.
PriorytetNiski
DataPoprzednia wartośćKolejna wartośćPrzewidywana wartość
2025-10-28-43.2%88.4%
2025-09-25-10.4%-43.2%
2025-08-28-5.1%-10.4%
2025-07-240.2%-5.1%
2025-06-25-19.2%0.2%
2025-05-2724.8%-19.2%
2025-04-243.2%24.8%
2025-03-2526.4%3.2%
2025-02-25-14.9%26.4%
2025-01-21-1.8%-14.9%
2024-12-194.0%-1.8%
2024-11-2176.0%4.0%
2024-10-22-44.6%76.0%
2024-09-19-21.9%-44.6%
2024-08-2914.7%-21.9%
2024-07-183.1%14.7%
2024-06-20-16.5%3.1%
2024-05-2210.2%-16.5%
2024-04-183.6%10.2%
2024-03-2127.7%3.6%
2024-02-20-20.2%27.7%
2024-01-180.1%-20.2%
2023-12-202.1%0.1%
2023-11-2170.9%2.1%
2023-10-20-33.1%70.9%
2023-09-20-14.2%-33.1%
2023-08-30-7.0%-14.2%
2023-07-1918.7%-7.0%
2023-06-21-25.2%18.7%
2023-05-1729.1%-25.2%
2023-04-191.4%29.1%
2023-03-2122.4%1.4%
2023-02-21-12.5%22.4%
2023-01-183.5%-12.5%
2022-12-154.4%3.5%
2022-11-1755.9%4.4%
2022-10-18-35.0%55.9%
2022-09-164.9%-35.0%
2022-07-1524.6%4.9%
2022-06-16-18.5%24.6%
2022-05-187.8%-18.5%
2022-04-202.8%7.8%
2022-03-1724.4%2.8%
2022-02-17-17.0%24.4%
2022-01-183.4%-17.0%
2021-12-17-4.0%3.4%
2021-11-1862.6%-4.0%
2021-10-15-41.4%62.6%
2021-09-16-26.2%-41.4%
2021-08-164.7%-26.2%
2021-07-16-1.6%4.7%
2021-06-17-14.5%-1.6%
2021-05-1918.7%-14.5%
2021-04-166.7%18.7%
2021-03-1712.2%6.7%
2021-02-17-13.7%12.2%
2021-01-19-11.8%-13.7%
2020-12-170.5%-11.8%
2020-11-1875.8%0.5%
2020-10-16-35.0%75.8%
2020-09-1732.8%-35.0%
2020-07-162,230.2%32.8%
2020-06-17-84.9%2,230.2%
2020-05-19-82.6%-84.9%
2020-04-174.7%-82.6%
2020-03-1811.0%4.7%
2020-02-18-7.0%11.0%
2020-01-16-4.0%-7.0%
2019-12-1710.4%-4.0%
2019-11-1959.8%10.4%
2019-10-16-41.9%59.8%
2019-09-180-41.9%
05:00
Italian Car Registration (YoY) (Oct) 4,2%   -0,5%
OpisThe car registrations published by the European Automobile Manufacturers’ Association (ACEA) describe the number of new passenger car registrations in Italy. If the number increases, this is a sign of increasing consumption. At the same time, Italian carmakers are earning more money, leading to rising profits. This generally boosts the economy - and vice versa. If car registrations are higher than expected, this usually leads to a rising euro (EUR) exchange rate on the currency markets. Conversely, the euro exchange rate (EUR) falls if new registrations are lower than expected or if expectations are missed.
PriorytetNiski
DataPoprzednia wartośćKolejna wartośćPrzewidywana wartość
2025-11-044.2%-0.6%
2025-10-28-2.7%4.2%
2025-10-01-2.7%-2.7%
2025-09-25-5.1%-2.7%
2025-09-01-5.1%-5.1%
2025-08-28-17.4%-5.1%
2025-08-01-17.4%-17.4%
2025-07-24-0.1%-17.4%
2025-07-01-0.1%-0.1%
2025-06-252.7%-0.1%
2025-06-032.7%2.7%
2025-05-276.3%2.7%
2025-05-02-6.2%6.3%
2025-04-24-6.2%-6.2%
2025-03-25-5.8%-6.2%
2025-03-03-5.8%-5.8%
2025-02-25-4.9%-5.8%
2025-02-03-4.9%-4.9%
2025-01-21-10.8%-4.9%
2024-12-19-9.1%-10.8%
2024-12-02-9.1%-9.1%
2024-11-21-10.7%-9.1%
2024-11-06-10.7%-10.7%
2024-10-22-13.4%-10.7%
2024-10-01-13.4%-13.4%
2024-09-194.7%-13.4%
2024-09-024.7%4.7%
2024-08-2915.1%4.7%
2024-08-0115.1%15.1%
2024-07-18-6.6%15.1%
2024-07-03-6.6%-6.6%
2024-06-207.7%-6.6%
2024-05-22-3.7%7.7%
2024-05-02-3.7%-3.7%
2024-04-1812.8%-3.7%
2024-03-2110.6%12.8%
2024-02-205.9%10.6%
2024-01-1816.2%5.9%
2023-12-2020.0%16.2%
2023-11-2122.7%20.0%
2023-11-0222.8%22.7%
2023-10-2011.9%22.8%
2023-10-0211.9%11.9%
2023-09-208.7%11.9%
2023-08-309.1%8.7%
2023-07-1923.1%9.1%
2023-07-0323.1%23.1%
2023-06-2129.3%23.1%
2023-06-0129.3%29.3%
2023-05-1740.7%29.3%
2023-04-1917.4%40.7%
2023-03-2119.1%17.4%
2023-02-2121.0%19.1%
2023-01-1814.7%21.0%
2022-12-1514.6%14.7%
2022-11-175.4%14.6%
2022-10-189.9%5.4%
2022-09-16-15.0%9.9%
2022-07-15-15.1%-15.0%
2022-06-16-33.0%-15.1%
2022-05-18-29.7%-33.0%
2022-04-20-22.6%-29.7%
2022-03-17-19.7%-22.6%
2022-02-17-27.5%-19.7%
2022-01-18-24.6%-27.5%
2021-12-17-35.7%-24.6%
2021-11-18-32.7%-35.7%
2021-10-15-27.3%-32.7%
2021-09-16-19.4%-27.3%
2021-08-1612.6%-19.4%
2021-07-1643.0%12.6%
2021-06-173,276.8%43.0%
2021-05-19497.2%3,276.8%
2021-04-16-12.3%497.2%
2021-03-17-14.0%-12.3%
2021-02-17-14.9%-14.0%
2021-01-19-8.3%-14.9%
2020-12-17-0.2%-8.3%
2020-11-189.5%-0.2%
2020-10-16-0.4%9.5%
2020-09-17-23.1%-0.4%
2020-07-16-49.6%-23.1%
2020-06-17-97.6%-49.6%
2020-05-19-85.4%-97.6%
2020-04-17-8.8%-85.4%
2020-03-18-5.9%-8.8%
2020-02-1812.5%-5.9%
2020-01-162.2%12.5%
2019-12-176.7%2.2%
2019-11-1913.4%6.7%
2019-10-16-3.1%13.4%
2019-09-180-3.1%
05:00
German Car Registration (MoM) (Oct) 13,7%   6,2%
OpisThe car registrations published by the European Automobile Manufacturers’ Association (ACEA) describe the number of new passenger car registrations in Germany. If the number increases, this is a sign of increasing consumption. At the same time, German carmakers are earning more money, leading to rising profits. This generally boosts the economy - and vice versa. If car registrations are higher than expected, this usually leads to a rising euro (EUR) exchange rate on the currency markets. Conversely, the euro exchange rate (EUR) falls if new registrations are lower than expected or if expectations are missed.
PriorytetNiski
DataPoprzednia wartośćKolejna wartośćPrzewidywana wartość
2025-10-28-21.7%13.7%
2025-09-253.4%-21.7%
2025-08-287.1%3.4%
2025-07-24-1.4%7.1%
2025-06-25-4.2%-1.4%
2025-05-2724.6%-4.2%
2025-04-24-2.0%24.6%
2025-03-25-7.6%-2.0%
2025-02-25-8.1%-7.6%
2025-01-215.4%-8.1%
2024-12-1911.1%5.4%
2024-11-215.8%11.1%
2024-10-22-17.2%5.8%
2024-09-19-19.9%-17.2%
2024-08-2925.8%-19.9%
2024-07-18-2.7%25.8%
2024-06-20-7.9%-2.7%
2024-05-2221.4%-7.9%
2024-04-181.8%21.4%
2024-03-21-11.7%1.8%
2024-02-20-1.6%-11.7%
2024-01-1812.2%-1.6%
2023-12-20-2.5%12.2%
2023-11-21-17.9%-2.5%
2023-10-2012.4%-17.9%
2023-09-20-13.2%12.4%
2023-08-3013.4%-13.2%
2023-07-1921.7%13.4%
2023-06-21-27.9%21.7%
2023-05-1736.4%-27.9%
2023-04-1915.0%36.4%
2023-03-21-43.0%15.0%
2023-02-2120.7%-43.0%
2023-01-1824.9%20.7%
2022-12-15-7.2%24.9%
2022-11-1712.9%-7.2%
2022-10-18-3.3%12.9%
2022-09-168.4%-3.3%
2022-07-1514.9%8.4%
2022-06-16-25.3%14.9%
2022-05-1820.4%-25.3%
2022-04-208.9%20.4%
2022-03-17-19.1%8.9%
2022-02-1714.8%-19.1%
2022-01-1811.0%14.8%
2021-12-17-9.3%11.0%
2021-11-181.9%-9.3%
2021-10-15-18.2%1.9%
2021-09-16-13.8%-18.2%
2021-08-1618.9%-13.8%
2021-07-160.4%18.9%
2021-06-17-21.4%0.4%
2021-05-1950.4%-21.4%
2021-04-1614.5%50.4%
2021-03-17-45.5%14.5%
2021-02-177.3%-45.5%
2021-01-195.8%7.3%
2020-12-173.4%5.8%
2020-11-185.6%3.4%
2020-11-045.6%5.6%
2020-10-16-20.3%5.6%
2020-09-1731.0%-20.3%
2020-07-1639.1%31.0%
2020-06-17-43.8%39.1%
2020-06-04-43.8%-43.8%
2020-05-19-10.3%-43.8%
2020-04-17-2.6%-10.3%
2020-03-18-13.1%-2.6%
2020-02-18-5.3%-13.1%
2020-01-165.1%-5.3%
2019-12-1716.3%5.1%
2019-11-19-22.0%16.3%
2019-10-16-5.7%-22.0%
2019-09-180-5.7%
05:00
German Car Registration (YoY) (Oct) 12,8%   7,8%
OpisThe car registrations published by the European Automobile Manufacturers’ Association (ACEA) describe the number of new passenger car registrations in Germany. If the number increases, this is a sign of increasing consumption. At the same time, German carmakers are earning more money, leading to rising profits. This generally boosts the economy - and vice versa. If car registrations are higher than expected, this usually leads to a rising euro (EUR) exchange rate on the currency markets. Conversely, the euro exchange rate (EUR) falls if new registrations are lower than expected or if expectations are missed.
PriorytetNiski
DataPoprzednia wartośćKolejna wartośćPrzewidywana wartość
2025-10-285.0%12.8%
2025-10-085.0%5.0%
2025-09-2511.1%5.0%
2025-09-0311.1%11.1%
2025-08-28-13.8%11.1%
2025-08-05-13.8%-13.8%
2025-07-241.2%-13.8%
2025-07-031.2%1.2%
2025-06-25-0.2%1.2%
2025-06-04-0.2%-0.2%
2025-05-27-3.9%-0.2%
2025-05-06-3.9%-3.9%
2025-04-24-6.4%-3.9%
2025-04-04-6.4%-6.4%
2025-03-25-2.8%-6.4%
2025-03-06-2.8%-2.8%
2025-02-25-7.1%-2.8%
2025-02-06-7.1%-7.1%
2025-01-21-0.5%-7.1%
2025-01-06-0.5%-0.5%
2024-12-196.0%-0.5%
2024-11-21-7.0%6.0%
2024-11-06-7.0%-7.0%
2024-10-22-27.8%-7.0%
2024-10-04-27.8%-27.8%
2024-09-19-2.1%-27.8%
2024-09-05-2.1%-2.1%
2024-08-296.1%-2.1%
2024-07-18-4.3%6.1%
2024-07-03-4.3%-4.3%
2024-06-2019.8%-4.3%
2024-06-0519.8%19.8%
2024-05-22-6.2%19.8%
2024-05-06-6.2%-6.2%
2024-04-185.4%-6.2%
2024-04-045.4%5.4%
2024-03-2119.1%5.4%
2024-03-0619.1%19.1%
2024-02-20-23.0%19.1%
2024-02-06-23.0%-23.0%
2024-01-18-5.7%-23.0%
2024-01-05-5.7%-5.7%
2023-12-204.9%-5.7%
2023-12-054.9%4.9%
2023-11-21-0.1%4.9%
2023-10-2037.3%-0.1%
2023-09-2018.1%37.3%
2023-08-3024.8%18.1%
2023-07-1919.2%24.8%
2023-06-2112.6%19.2%
2023-06-0512.6%12.6%
2023-05-1716.6%12.6%
2023-04-192.8%16.6%
2023-03-21-2.6%2.8%
2023-02-2138.1%-2.6%
2023-01-1831.4%38.1%
2022-12-1516.8%31.4%
2022-11-1714.1%16.8%
2022-10-183.0%14.1%
2022-09-16-18.1%3.0%
2022-07-15-10.2%-18.1%
2022-06-16-21.5%-10.2%
2022-05-18-17.5%-21.5%
2022-04-203.2%-17.5%
2022-03-178.5%3.2%
2022-02-17-26.9%8.5%
2022-01-18-31.7%-26.9%
2021-12-17-34.9%-31.7%
2021-11-18-25.7%-34.9%
2021-10-15-23.0%-25.7%
2021-09-16-24.9%-23.0%
2021-08-1624.5%-24.9%
2021-07-1637.2%24.5%
2021-07-0537.2%37.2%
2021-06-1790.0%37.2%
2021-05-1935.9%90.0%
2021-04-16-19.0%35.9%
2021-03-17-31.1%-19.0%
2021-02-179.9%-31.1%
2021-01-19-3.0%9.9%
2020-12-17-3.6%-3.0%
2020-11-188.4%-3.6%
2020-11-048.4%8.4%
2020-10-16-20.0%8.4%
2020-09-17-32.3%-20.0%
2020-07-16-49.5%-32.3%
2020-06-17-61.1%-49.5%
2020-06-04-61.1%-61.1%
2020-05-19-37.7%-61.1%
2020-04-17-10.8%-37.7%
2020-03-18-7.3%-10.8%
2020-02-1819.5%-7.3%
2020-01-169.7%19.5%
2019-12-1712.7%9.7%
2019-11-1922.2%12.7%
2019-10-16-0.8%22.2%
2019-09-180-0.8%
05:00
Car Registration (YoY) (Oct) 4,4%   8,3%
OpisThe car registrations published by the European Automobile Manufacturers’ Association (ACEA) describe the number of new passenger car registrations in the United Kingdom. If the number increases, this is a sign of increasing consumption. At the same time, British carmakers are earning more money, leading to rising profits. This generally boosts the economy - and vice versa. If car registrations are higher than expected, this usually leads to a rising pound (GBP) exchange rate on the currency markets. Conversely, the pound exchange rate (GBP) falls if new registrations are lower than expected or if expectations are missed.
PriorytetNiski
DataPoprzednia wartośćKolejna wartośćPrzewidywana wartość
2025-10-28-2.7%4.4%
2025-09-259.0%-2.7%
2025-08-28-1.5%9.0%
2025-07-247.3%-1.5%
2025-06-25-4.0%7.3%
2025-05-27-14.8%-4.0%
2025-04-24-8.3%-14.8%
2025-03-25-4.6%-8.3%
2025-02-2540.3%-4.6%
2025-01-2122.0%40.3%
2024-12-1913.7%22.0%
2024-11-215.1%13.7%
2024-10-22-0.4%5.1%
2024-09-19-6.2%-0.4%
2024-08-29-11.9%-6.2%
2024-07-18-13.9%-11.9%
2024-06-20-3.8%-13.9%
2024-05-22-0.5%-3.8%
2024-04-188.9%-0.5%
2024-03-215.5%8.9%
2024-02-20-13.8%5.5%
2024-01-181.8%-13.8%
2023-12-20-1.5%1.8%
2023-11-2116.6%-1.5%
2023-10-2018.6%16.6%
2023-09-2030.7%18.6%
2023-08-3037.8%30.7%
2023-07-1941.0%37.8%
2023-06-2134.3%41.0%
2023-05-17034.3%
05:00
Car Registration (MoM) (Oct) 20,8%   7,8%
OpisThe car registrations published by the European Automobile Manufacturers’ Association (ACEA) describe the number of new passenger car registrations in the United Kingdom. If the number increases, this is a sign of increasing consumption. At the same time, British carmakers are earning more money, leading to rising profits. This generally boosts the economy - and vice versa. If car registrations are higher than expected, this usually leads to a rising pound (GBP) exchange rate on the currency markets. Conversely, the pound exchange rate (GBP) falls if new registrations are lower than expected or if expectations are missed.
PriorytetNiski
DataPoprzednia wartośćKolejna wartośćPrzewidywana wartość
2025-10-28-8.0%20.8%
2025-09-25-16.3%-8.0%
2025-08-2814.8%-16.3%
2025-07-2411.2%14.8%
2025-06-25-13.8%11.2%
2025-05-2713.3%-13.8%
2025-04-24-15.2%13.3%
2025-03-25-11.5%-15.2%
2025-02-257.7%-11.5%
2025-01-216.9%7.7%
2024-12-193.1%6.9%
2024-11-2113.1%3.1%
2024-10-222.9%13.1%
2024-09-19-24.2%2.9%
2024-08-2924.8%-24.2%
2024-07-18-0.2%24.8%
2024-06-20-23.4%-0.2%
2024-05-2222.0%-23.4%
2024-04-18-11.8%22.0%
2024-03-2129.7%-11.8%
2024-02-20-5.9%29.7%
2024-01-18-0.4%-5.9%
2023-12-20-5.0%-0.4%
2023-11-217.3%-5.0%
2023-10-20-3.0%7.3%
2023-09-20-30.6%-3.0%
2023-08-3024.8%-30.6%
2023-07-1911.7%24.8%
2023-06-21-20.8%11.7%
2023-05-170-20.8%
05:00
French Car Registration (MoM) (Oct) 59,8%   -0,6%
OpisThe car registrations published by the European Automobile Manufacturers’ Association (ACEA) describe the number of new passenger car registrations in France. If the number increases, this is a sign of increasing consumption. At the same time, French carmakers are earning more money, leading to rising profits. This generally boosts the economy - and vice versa. If car registrations are higher than expected, this usually leads to a rising euro (EUR) exchange rate on the currency markets. Conversely, the euro exchange rate (EUR) falls if new registrations are lower than expected or if expectations are missed.
PriorytetNiski
DataPoprzednia wartośćKolejna wartośćPrzewidywana wartość
2025-10-28-24.5%59.8%
2025-09-25-31.3%-24.5%
2025-08-2836.8%-31.3%
2025-07-24-10.7%36.8%
2025-06-25-9.8%-10.7%
2025-05-278.7%-9.8%
2025-04-2423.5%8.7%
2025-03-25-37.6%23.5%
2025-02-2537.8%-37.6%
2025-01-21-1.6%37.8%
2024-12-19-2.5%-1.6%
2024-11-2161.7%-2.5%
2024-10-22-31.8%61.7%
2024-09-19-30.6%-31.8%
2024-08-2928.6%-30.6%
2024-07-18-3.9%28.6%
2024-06-20-18.4%-3.9%
2024-05-2226.2%-18.4%
2024-04-1816.6%26.2%
2024-03-21-32.4%16.6%
2024-02-2018.5%-32.4%
2024-01-180.2%18.5%
2023-12-20-2.5%0.2%
2023-11-2137.6%-2.5%
2023-10-20-11.9%37.6%
2023-09-20-32.4%-11.9%
2023-08-3031.1%-32.4%
2023-07-199.8%31.1%
2023-06-21-27.5%9.8%
2023-05-1744.7%-27.5%
2023-04-1912.8%44.7%
2023-03-21-29.2%12.8%
2023-02-2118.0%-29.2%
2023-01-187.2%18.0%
2022-12-15-11.4%7.2%
2022-11-1754.4%-11.4%
2022-10-18-15.0%54.4%
2022-09-1634.9%-15.0%
2022-07-1516.6%34.9%
2022-06-16-26.1%16.6%
2022-05-1827.5%-26.1%
2022-04-2012.1%27.5%
2022-03-17-34.9%12.1%
2022-02-1729.6%-34.9%
2022-01-182.9%29.6%
2021-12-17-11.4%2.9%
2021-11-1852.0%-11.4%
2021-10-15-23.9%52.0%
2021-09-16-42.0%-23.9%
2021-08-1641.5%-42.0%
2021-07-160.4%41.5%
2021-06-17-23.2%0.4%
2021-05-1937.8%-23.2%
2021-04-165.0%37.8%
2021-03-17-32.2%5.0%
2021-02-1747.8%-32.2%
2021-01-19-26.3%47.8%
2020-12-171.6%-26.3%
2020-11-1862.4%1.6%
2020-11-0262.4%62.4%
2020-10-16-42.1%62.4%
2020-09-17142.8%-42.1%
2020-08-27142.8%142.8%
2020-07-16358.7%142.8%
2020-06-17-66.5%358.7%
2020-05-19-62.6%-66.5%
2020-04-1725.0%-62.6%
2020-03-18-36.4%25.0%
2020-02-1822.3%-36.4%
2020-01-16-8.6%22.3%
2019-12-179.0%-8.6%
2019-11-1934.2%9.0%
2019-10-16-24.9%34.2%
2019-09-180-24.9%
05:00
French Car Registration (YoY) (Oct) 1,0%   2,9%
OpisThe car registrations published by the European Automobile Manufacturers’ Association (ACEA) describe the number of new passenger car registrations in France. If the number increases, this is a sign of increasing consumption. At the same time, French carmakers are earning more money, leading to rising profits. This generally boosts the economy - and vice versa. If car registrations are higher than expected, this usually leads to a rising euro (EUR) exchange rate on the currency markets. Conversely, the euro exchange rate (EUR) falls if new registrations are lower than expected or if expectations are missed.
PriorytetNiski
DataPoprzednia wartośćKolejna wartośćPrzewidywana wartość
2025-11-031.0%2.9%
2025-10-282.2%1.0%
2025-10-032.2%2.2%
2025-09-25-7.7%2.2%
2025-09-03-7.7%-7.7%
2025-08-28-6.7%-7.7%
2025-08-04-6.7%-6.7%
2025-07-02-12.3%-6.7%
2025-06-25-5.6%-12.3%
2025-06-03-5.6%-5.6%
2025-05-27-14.5%-5.6%
2025-05-05-14.5%-14.5%
2025-04-24-0.7%-14.5%
2025-04-04-0.7%-0.7%
2025-03-25-6.2%-0.7%
2025-02-28-6.2%-6.2%
2025-02-251.5%-6.2%
2025-02-041.5%1.5%
2025-01-21-12.7%1.5%
2024-12-19-11.1%-12.7%
2024-11-21-11.1%-11.1%
2024-11-04-11.1%-11.1%
2024-10-22-24.3%-11.1%
2024-10-09-24.3%-24.3%
2024-09-19-2.3%-24.3%
2024-09-05-2.3%-2.3%
2024-08-29-4.8%-2.3%
2024-07-18-2.9%-4.8%
2024-07-03-2.9%-2.9%
2024-06-2010.9%-2.9%
2024-06-0610.9%10.9%
2024-05-22-1.5%10.9%
2024-05-02-1.5%-1.5%
2024-04-1813.0%-1.5%
2024-04-0413.0%13.0%
2024-03-219.2%13.0%
2024-03-049.2%9.2%
2024-02-2014.5%9.2%
2024-01-1814.0%14.5%
2024-01-0414.0%14.0%
2023-12-2021.9%14.0%
2023-11-2110.7%21.9%
2023-10-2024.3%10.7%
2023-09-2019.9%24.3%
2023-08-3011.5%19.9%
2023-07-1914.8%11.5%
2023-07-0314.8%14.8%
2023-06-2121.9%14.8%
2023-06-0621.9%21.9%
2023-05-1724.2%21.9%
2023-04-199.4%24.2%
2023-03-218.8%9.4%
2023-02-21-0.1%8.8%
2023-01-189.8%-0.1%
2022-12-155.5%9.8%
2022-12-085.5%5.5%
2022-11-175.5%5.5%
2022-10-183.8%5.5%
2022-09-16-14.2%3.8%
2022-07-15-10.1%-14.2%
2022-06-16-22.6%-10.1%
2022-05-18-19.5%-22.6%
2022-04-20-13.0%-19.5%
2022-03-17-18.6%-13.0%
2022-02-17-15.1%-18.6%
2022-01-18-3.2%-15.1%
2021-12-17-30.7%-3.2%
2021-11-18-20.5%-30.7%
2021-10-15-15.0%-20.5%
2021-09-16-35.3%-15.0%
2021-08-16-14.7%-35.3%
2021-07-1646.4%-14.7%
2021-06-17568.8%46.4%
2021-06-01568.8%568.8%
2021-05-19191.7%568.8%
2021-05-03191.4%191.7%
2021-04-16-20.9%191.4%
2021-04-01-20.9%-20.9%
2021-03-17-5.8%-20.9%
2021-03-01-5.8%-5.8%
2021-02-17-11.8%-5.8%
2021-02-01-11.8%-11.8%
2021-01-19-27.0%-11.8%
2021-01-04-27.0%-27.0%
2020-12-17-9.5%-27.0%
2020-12-01-9.5%-9.5%
2020-11-18-3.0%-9.5%
2020-11-02-3.0%-3.0%
2020-10-16-19.8%-3.0%
2020-10-01-19.8%-19.8%
2020-09-171.2%-19.8%
2020-09-013.9%1.2%
2020-08-031.2%3.9%
2020-07-16-50.3%1.2%
2020-06-17-88.8%-50.3%
2020-05-19-72.2%-88.8%
2020-04-17-2.7%-72.2%
2020-03-18-13.4%-2.7%
2020-02-1827.7%-13.4%
2020-01-160.7%27.7%
2019-12-178.7%0.7%
2019-11-1916.6%8.7%
2019-10-16-14.1%16.6%
2019-09-180-14.1%
05:00
Car Registration (MoM) (Oct) 17,40%   5,80%
OpisThe car registrations published by the European Automobile Manufacturers’ Association (ACEA) describe the number of new passenger car registrations in the United Kingdom. If the number increases, this is a sign of increasing consumption. At the same time, British carmakers are earning more money, leading to rising profits. This generally boosts the economy - and vice versa. If car registrations are higher than expected, this usually leads to a rising pound (GBP) exchange rate on the currency markets. Conversely, the pound exchange rate (GBP) falls if new registrations are lower than expected or if expectations are missed.
PriorytetNiski
DataPoprzednia wartośćKolejna wartośćPrzewidywana wartość
2025-10-28-15.50%17.40%
2025-09-251.40%-15.50%
2025-08-286.30%1.40%
2025-07-24-0.70%6.30%
2025-06-25-11.50%-0.70%
2025-05-2718.50%-11.50%
2025-04-241.20%18.50%
2025-03-25-20.50%1.20%
2025-02-2513.30%-20.50%
2025-01-212.20%13.30%
2024-12-1916.00%2.20%
2024-11-2111.80%16.00%
2024-10-22-14.10%11.80%
2024-09-19-14.10%-14.10%
2024-08-2915.00%-14.10%
2024-07-18-1.60%15.00%
2024-06-20-11.10%-1.60%
2024-05-228.60%-11.10%
2024-04-187.40%8.60%
2024-03-211.60%7.40%
2024-02-201.00%1.60%
2024-01-181.90%1.00%
2023-12-204.70%1.90%
2023-11-218.00%4.70%
2023-10-20-0.60%8.00%
2023-09-20-12.50%-0.60%
2023-08-307.80%-12.50%
2023-07-198.70%7.80%
2023-06-21-28.30%8.70%
2023-05-170-28.30%
05:00
Car Registration (YoY) (Oct) 20,20%   9,60%
OpisThe car registrations published by the European Automobile Manufacturers’ Association (ACEA) describe the number of new passenger car registrations in the United Kingdom. If the number increases, this is a sign of increasing consumption. At the same time, British carmakers are earning more money, leading to rising profits. This generally boosts the economy - and vice versa. If car registrations are higher than expected, this usually leads to a rising pound (GBP) exchange rate on the currency markets. Conversely, the pound exchange rate (GBP) falls if new registrations are lower than expected or if expectations are missed.
PriorytetNiski
DataPoprzednia wartośćKolejna wartośćPrzewidywana wartość
2025-10-2814.60%20.20%
2025-09-2516.50%14.60%
2025-08-28-1.30%16.50%
2025-07-246.80%-1.30%
2025-06-255.80%6.80%
2025-05-276.30%5.80%
2025-04-24-2.60%6.30%
2025-03-253.40%-2.60%
2025-02-2532.20%3.40%
2025-01-2117.90%32.20%
2024-12-1917.60%17.90%
2024-11-216.10%17.60%
2024-10-222.50%6.10%
2024-09-1918.60%2.50%
2024-08-2920.80%18.60%
2024-07-1813.20%20.80%
2024-06-2025.10%13.20%
2024-05-220.90%25.10%
2024-04-1819.30%0.90%
2024-03-2122.10%19.30%
2024-02-2014.20%22.10%
2024-01-1821.90%14.20%
2023-12-2027.80%21.90%
2023-11-219.10%27.80%
2023-10-207.20%9.10%
2023-09-204.90%7.20%
2023-08-305.00%4.90%
2023-07-197.50%5.00%
2023-06-211.70%7.50%
2023-05-1701.70%
05:00
Car Registration (YoY) (Oct) 17,10%   10,60%
OpisThe car registrations published by the European Automobile Manufacturers’ Association (ACEA) describe the number of new passenger car registrations in the United Kingdom. If the number increases, this is a sign of increasing consumption. At the same time, British carmakers are earning more money, leading to rising profits. This generally boosts the economy - and vice versa. If car registrations are higher than expected, this usually leads to a rising pound (GBP) exchange rate on the currency markets. Conversely, the pound exchange rate (GBP) falls if new registrations are lower than expected or if expectations are missed.
PriorytetNiski
DataPoprzednia wartośćKolejna wartośćPrzewidywana wartość
2025-10-283.10%17.10%
2025-09-2519.30%3.10%
2025-08-28-0.60%19.30%
2025-06-258.60%-0.60%
2025-05-2719.30%8.60%
2025-04-24-3.00%19.30%
2025-03-25-5.00%-3.00%
2025-02-2518.30%-5.00%
2025-01-216.30%18.30%
2024-12-199.00%6.30%
2024-11-216.00%9.00%
2024-10-22-8.70%6.00%
2024-09-198.50%-8.70%
2024-08-299.10%8.50%
2024-07-18-2.80%9.10%
2024-06-206.10%-2.80%
2024-05-22-15.50%6.10%
2024-04-188.90%-15.50%
2024-03-2118.20%8.90%
2024-02-203.90%18.20%
2024-01-1811.50%3.90%
2023-12-2018.70%11.50%
2023-11-2115.50%18.70%
2023-10-2012.90%15.50%
2023-09-2019.60%12.90%
2023-08-309.30%19.60%
2023-07-1912.30%9.30%
2023-06-2125.20%12.30%
2023-05-17025.20%
05:00
Car Registration (MoM) (Oct) 21,30%   9,00%
OpisThe car registrations published by the European Automobile Manufacturers’ Association (ACEA) describe the number of new passenger car registrations in the United Kingdom. If the number increases, this is a sign of increasing consumption. At the same time, British carmakers are earning more money, leading to rising profits. This generally boosts the economy - and vice versa. If car registrations are higher than expected, this usually leads to a rising pound (GBP) exchange rate on the currency markets. Conversely, the pound exchange rate (GBP) falls if new registrations are lower than expected or if expectations are missed.
PriorytetNiski
DataPoprzednia wartośćKolejna wartośćPrzewidywana wartość
2025-10-28-15.40%21.30%
2025-09-25-6.30%-15.40%
2025-08-2813.80%-6.30%
2025-07-24-8.00%13.80%
2025-06-25-5.90%-8.00%
2025-05-2727.00%-5.90%
2025-04-24-8.10%27.00%
2025-03-258.20%-8.10%
2025-02-25-13.30%8.20%
2025-01-21-2.00%-13.30%
2024-12-1915.50%-2.00%
2024-11-216.80%15.50%
2024-10-22-2.10%6.80%
2024-09-19-21.90%-2.10%
2024-08-2913.20%-21.90%
2024-07-181.00%13.20%
2024-06-203.30%1.00%
2024-05-223.20%3.30%
2024-04-18-9.50%3.20%
2024-03-2133.90%-9.50%
2024-02-20-22.10%33.90%
2024-01-180.50%-22.10%
2023-12-2012.30%0.50%
2023-11-21-8.10%12.30%
2023-10-2016.30%-8.10%
2023-09-20-21.40%16.30%
2023-08-300.90%-21.40%
2023-07-1910.10%0.90%
2023-06-21-17.60%10.10%
2023-05-170-17.60%
05:00
Car Registration (MoM) (Oct) 7,6%   14,3%
OpisThe car registrations published by the European Automobile Manufacturers’ Association (ACEA) describe the number of new passenger car registrations in the United Kingdom. If the number increases, this is a sign of increasing consumption. At the same time, British carmakers are earning more money, leading to rising profits. This generally boosts the economy - and vice versa. If car registrations are higher than expected, this usually leads to a rising pound (GBP) exchange rate on the currency markets. Conversely, the pound exchange rate (GBP) falls if new registrations are lower than expected or if expectations are missed.
PriorytetNiski
DataPoprzednia wartośćKolejna wartośćPrzewidywana wartość
2025-10-28-20.8%7.6%
2025-09-25-4.1%-20.8%
2025-08-2815.0%-4.1%
2025-07-24-8.1%15.0%
2025-06-2510.9%-8.1%
2025-05-2721.0%10.9%
2025-04-24-6.1%21.0%
2025-03-25-23.8%-6.1%
2025-02-25-4.6%-23.8%
2025-01-211.4%-4.6%
2024-12-1922.4%1.4%
2024-11-213.0%22.4%
2024-10-224.2%3.0%
2024-09-19-21.2%4.2%
2024-08-2918.6%-21.2%
2024-07-18-5.4%18.6%
2024-06-20-0.6%-5.4%
2024-05-220.7%-0.6%
2024-04-18-2.9%0.7%
2024-03-2148.9%-2.9%
2024-02-20-24.6%48.9%
2024-01-18-9.5%-24.6%
2023-12-2013.8%-9.5%
2023-11-21-8.4%13.8%
2023-10-20-6.4%-8.4%
2023-09-20-4.4%-6.4%
2023-08-304.1%-4.4%
2023-07-1916.6%4.1%
2023-06-21-22.1%16.6%
2023-05-170-22.1%
05:00
Car Registration (YoY) (Oct) 10,2%   -8,3%
OpisThe car registrations published by the European Automobile Manufacturers’ Association (ACEA) describe the number of new passenger car registrations in the United Kingdom. If the number increases, this is a sign of increasing consumption. At the same time, British carmakers are earning more money, leading to rising profits. This generally boosts the economy - and vice versa. If car registrations are higher than expected, this usually leads to a rising pound (GBP) exchange rate on the currency markets. Conversely, the pound exchange rate (GBP) falls if new registrations are lower than expected or if expectations are missed.
PriorytetNiski
DataPoprzednia wartośćKolejna wartośćPrzewidywana wartość
2025-10-28-6.0%10.2%
2025-09-2523.7%-6.0%
2025-08-280.6%23.7%
2025-07-244.9%0.6%
2025-06-257.9%4.9%
2025-05-27-3.2%7.9%
2025-04-24-19.4%-3.2%
2025-03-25-16.8%-19.4%
2025-02-2562.8%-16.8%
2025-01-218.3%62.8%
2024-12-1914.8%8.3%
2024-11-21-7.8%14.8%
2024-10-22-5.1%-7.8%
2024-09-19-14.8%-5.1%
2024-08-293.3%-14.8%
2024-07-18-9.3%3.3%
2024-06-2011.9%-9.3%
2024-05-22-12.4%11.9%
2024-04-1816.3%-12.4%
2024-03-2118.8%16.3%
2024-02-20-17.4%18.8%
2024-01-184.5%-17.4%
2023-12-203.7%4.5%
2023-11-2131.0%3.7%
2023-10-2011.8%31.0%
2023-09-2028.6%11.8%
2023-08-304.3%28.6%
2023-07-1920.9%4.3%
2023-06-2113.8%20.9%
2023-05-17013.8%
05:00
Car Registration (YoY) (Oct) 14,40%   7,70%
OpisThe car registrations published by the European Automobile Manufacturers’ Association (ACEA) describe the number of new passenger car registrations in the United Kingdom. If the number increases, this is a sign of increasing consumption. At the same time, British carmakers are earning more money, leading to rising profits. This generally boosts the economy - and vice versa. If car registrations are higher than expected, this usually leads to a rising pound (GBP) exchange rate on the currency markets. Conversely, the pound exchange rate (GBP) falls if new registrations are lower than expected or if expectations are missed.
PriorytetNiski
DataPoprzednia wartośćKolejna wartośćPrzewidywana wartość
2025-10-286.60%14.40%
2025-09-2526.80%6.60%
2025-08-28-1.80%26.80%
2025-07-2414.30%-1.80%
2025-06-253.60%14.30%
2025-05-272.40%3.60%
2025-04-24-1.50%2.40%
2025-03-2513.40%-1.50%
2025-02-2548.70%13.40%
2025-01-2128.40%48.70%
2024-12-1919.10%28.40%
2024-11-21-0.50%19.10%
2024-10-22-9.40%-0.50%
2024-09-192.20%-9.40%
2024-08-2923.90%2.20%
2024-07-185.70%23.90%
2024-06-2021.40%5.70%
2024-05-2212.20%21.40%
2024-04-1810.40%12.20%
2024-03-21-3.30%10.40%
2024-02-20-0.20%-3.30%
2024-01-18-12.60%-0.20%
2023-12-202.10%-12.60%
2023-11-21-3.10%2.10%
2023-10-20-10.40%-3.10%
2023-09-20-6.80%-10.40%
2023-08-30-1.40%-6.80%
2023-07-19-11.30%-1.40%
2023-06-21-6.00%-11.30%
2023-05-170-6.00%
05:00
Car Registration (MoM) (Oct) 20,00%   4,10%
OpisThe car registrations published by the European Automobile Manufacturers’ Association (ACEA) describe the number of new passenger car registrations in the United Kingdom. If the number increases, this is a sign of increasing consumption. At the same time, British carmakers are earning more money, leading to rising profits. This generally boosts the economy - and vice versa. If car registrations are higher than expected, this usually leads to a rising pound (GBP) exchange rate on the currency markets. Conversely, the pound exchange rate (GBP) falls if new registrations are lower than expected or if expectations are missed.
PriorytetNiski
DataPoprzednia wartośćKolejna wartośćPrzewidywana wartość
2025-10-28-20.00%20.00%
2025-09-25-6.10%-20.00%
2025-08-285.60%-6.10%
2025-06-25-18.30%5.60%
2025-05-2724.80%-18.30%
2025-04-2415.90%24.80%
2025-03-25-23.20%15.90%
2025-02-2511.60%-23.20%
2025-01-216.10%11.60%
2024-12-1910.60%6.10%
2024-11-2111.90%10.60%
2024-10-22-4.90%11.90%
2024-09-19-27.30%-4.90%
2024-08-2923.00%-27.30%
2024-07-18-8.40%23.00%
2024-06-20-19.30%-8.40%
2024-05-2220.10%-19.30%
2024-04-1833.50%20.10%
2024-03-210.70%33.50%
2024-02-20-3.80%0.70%
2024-01-18-1.50%-3.80%
2023-12-20-7.60%-1.50%
2023-11-211.90%-7.60%
2023-10-207.30%1.90%
2023-09-20-10.90%7.30%
2023-08-304.00%-10.90%
2023-07-195.30%4.00%
2023-06-21-25.60%5.30%
2023-05-170-25.60%
05:00
Car Registration (YoY) (Oct) 38,90%   11,10%
OpisThe car registrations published by the European Automobile Manufacturers’ Association (ACEA) describe the number of new passenger car registrations in the United Kingdom. If the number increases, this is a sign of increasing consumption. At the same time, British carmakers are earning more money, leading to rising profits. This generally boosts the economy - and vice versa. If car registrations are higher than expected, this usually leads to a rising pound (GBP) exchange rate on the currency markets. Conversely, the pound exchange rate (GBP) falls if new registrations are lower than expected or if expectations are missed.
PriorytetNiski
DataPoprzednia wartośćKolejna wartośćPrzewidywana wartość
2025-10-2851.70%38.90%
2025-09-2525.30%51.70%
2025-08-28-50.30%25.30%
2025-07-24-32.70%-50.30%
2025-06-25-24.70%-32.70%
2025-05-278.40%-24.70%
2025-04-244.50%8.40%
2025-03-25-6.40%4.50%
2025-02-2521.40%-6.40%
2025-01-21-8.10%21.40%
2024-12-191.40%-8.10%
2024-11-21-14.90%1.40%
2024-10-220.00%-14.90%
2024-08-2962.10%0.00%
2024-07-1814.70%62.10%
2024-06-2034.60%14.70%
2024-05-22-25.30%34.60%
2024-04-18-8.90%-25.30%
2024-03-213.80%-8.90%
2024-02-20-8.60%3.80%
2024-01-180.50%-8.60%
2023-12-208.10%0.50%
2023-11-21-11.60%8.10%
2023-10-202.80%-11.60%
2023-09-2012.70%2.80%
2023-08-3019.00%12.70%
2023-07-1933.80%19.00%
2023-06-2116.50%33.80%
2023-05-17016.50%
05:00
Car Registration (MoM) (Oct) -17,60%   3,00%
OpisThe car registrations published by the European Automobile Manufacturers’ Association (ACEA) describe the number of new passenger car registrations in the United Kingdom. If the number increases, this is a sign of increasing consumption. At the same time, British carmakers are earning more money, leading to rising profits. This generally boosts the economy - and vice versa. If car registrations are higher than expected, this usually leads to a rising pound (GBP) exchange rate on the currency markets. Conversely, the pound exchange rate (GBP) falls if new registrations are lower than expected or if expectations are missed.
PriorytetNiski
DataPoprzednia wartośćKolejna wartośćPrzewidywana wartość
2025-10-28-7.60%-17.60%
2025-09-2554.20%-7.60%
2025-08-280.90%54.20%
2025-07-245.30%0.90%
2025-06-250.70%5.30%
2025-05-27-16.30%0.70%
2025-04-24-0.60%-16.30%
2025-03-25-13.70%-0.60%
2025-02-2534.90%-13.70%
2025-01-21-11.40%34.90%
2024-12-1928.70%-11.40%
2024-11-21-30.40%28.70%
2024-10-22-1.30%-30.40%
2024-09-19-38.90%-1.30%
2024-08-2936.50%-38.90%
2024-07-1817.80%36.50%
2024-06-2045.00%17.80%
2024-05-22-19.30%45.00%
2024-04-18-10.90%-19.30%
2024-03-2112.00%-10.90%
2024-02-202.10%12.00%
2024-01-18-2.30%2.10%
2023-12-208.00%-2.30%
2023-11-21-18.20%8.00%
2023-10-20-5.40%-18.20%
2023-09-203.50%-5.40%
2023-08-30-3.40%3.50%
2023-07-1938.30%-3.40%
2023-06-21-19.50%38.30%
2023-05-170-19.50%
06:00
Finnish Unemployment Rate (Oct) 9,9%   10,3%
OpisThe definition for an unemployed person is: Persons (16-65 years) who were available for work (except for temporary illness) but did not work during the survey week, and who made specific efforts to find a job within the previous 4 weeks by going to an employment agency, by applying directly to an employer, by answering a job ad, or being on a union or professional register.The unemployment rate represents the number of unemployed persons expressed as a percentage of the labour force. The unemployment rate for a particular age/sex group is the number of unemployed in that group expressed as a percentage of the labour force for that group. A higher than expected reading should be taken as negative/bearish for the EUR , while a lower than expected reading should be taken as positive/bullish for the EUR.
PriorytetNiski
DataPoprzednia wartośćKolejna wartośćPrzewidywana wartość
2025-10-219.9%9.9%
2025-09-239.6%9.9%
2025-08-269.3%9.6%
2025-07-228.8%9.3%
2025-06-259.2%8.8%
2025-05-229.3%9.2%
2025-04-249.1%9.3%
2025-03-258.9%9.1%
2025-02-258.9%8.9%
2025-01-249.0%8.9%
2024-12-238.7%9.0%
2024-11-268.4%8.7%
2024-10-228.3%8.4%
2024-09-248.3%8.3%
2024-08-208.2%8.3%
2024-07-238.2%8.2%
2024-06-268.2%8.2%
2024-05-228.1%8.2%
2024-04-247.7%8.1%
2024-03-267.7%7.7%
2024-02-207.6%7.7%
2024-01-257.6%7.6%
2023-12-227.6%7.6%
2023-11-217.4%7.6%
2023-10-247.2%7.4%
2023-09-267.2%7.2%
2023-08-227.1%7.2%
2023-07-256.9%7.1%
2023-06-206.7%6.9%
2023-05-246.6%6.7%
2023-04-266.7%6.6%6.5%
2023-03-217.0%6.7%
2023-02-216.9%7.0%
2023-01-276.7%6.9%
2022-12-206.9%6.7%
2022-11-227.2%6.9%
2022-10-257.1%7.2%
2022-09-206.8%7.1%
2022-08-236.4%6.8%
2022-07-266.1%6.4%
2022-06-216.2%6.1%
2022-05-246.6%6.2%
2022-05-026.8%6.6%
2022-03-227.0%6.8%
2022-02-227.0%7.0%
2022-01-256.9%7.0%
2021-12-217.1%6.9%
2021-11-237.6%7.1%
2021-10-267.6%7.6%
2021-09-217.9%7.6%
2021-08-247.9%7.9%
2021-07-277.6%7.9%
2021-06-227.6%7.6%
2021-05-257.7%7.6%
2021-05-048.1%7.7%
2021-03-308.7%8.1%
2021-03-028.2%8.7%
2021-01-288.1%8.2%
2020-12-228.3%8.1%
2020-11-248.4%8.3%
2020-10-207.5%8.4%
2020-09-227.0%7.5%
2020-08-317.0%7.0%
2020-08-256.7%7.0%
2020-07-2110.6%6.7%
2020-06-246.8%10.6%
2020-05-276.6%6.8%
2020-04-236.6%6.6%
2020-03-246.8%6.6%
2020-02-256.7%6.8%
2020-01-246.7%6.7%
2019-12-206.7%6.7%
2019-11-266.7%6.7%
2019-10-226.7%6.7%
2019-09-246.6%6.7%
2019-08-206.5%6.6%
2019-07-236.6%6.5%
2019-06-256.6%6.6%
2019-05-236.4%6.6%
2019-04-246.5%6.4%
2019-03-266.4%6.5%
2019-02-266.6%6.4%
2019-01-247.1%6.6%
2018-12-217.2%7.1%
2018-11-207.3%7.2%
2018-10-237.4%7.3%
2018-09-257.5%7.4%
2018-08-217.3%7.5%
2018-07-247.3%7.3%
2018-06-268.0%7.3%8.0%
2018-05-238.0%8.0%
2018-04-248.4%8.0%
2018-03-208.4%8.4%
2018-02-208.5%8.4%
2018-01-258.4%8.5%
2017-12-228.3%8.4%
2017-11-218.5%8.3%
2017-10-248.7%8.5%
2017-09-268.7%8.7%
2017-08-228.6%8.7%
2017-07-258.7%8.6%
2017-06-208.8%8.7%
2017-05-248.9%8.8%
2017-04-278.7%8.9%
2017-03-218.7%8.7%
2017-02-218.7%8.7%
2017-01-248.6%8.7%
2016-12-208.7%8.6%
2016-11-228.6%8.7%
2016-10-258.7%8.6%
2016-09-208.7%8.7%
2016-08-238.9%8.7%
2016-07-268.9%8.9%
2016-06-219.0%8.9%
2016-05-249.1%9.0%
2016-04-269.2%9.1%
2016-03-229.3%9.2%
2016-02-239.4%9.3%
2016-01-279.4%9.4%
2015-12-229.2%9.4%
2015-11-249.3%9.2%
2015-10-209.4%9.3%
2015-09-229.5%9.4%
2015-08-259.6%9.5%
2015-07-219.6%9.6%
2015-06-249.6%9.6%
2015-05-279.5%9.6%
2015-04-239.3%9.5%
2015-03-249.1%9.3%
2015-02-249.0%9.1%
2015-01-209.1%9.0%
2014-12-238.9%9.1%
2014-11-258.7%8.9%
2014-10-218.4%8.7%
2014-09-238.3%8.4%
2014-08-268.60%8.3%
2014-07-228.60%8.60%
2014-06-248.50%8.60%
2014-05-208.50%8.50%
2014-04-248.50%8.50%
2014-03-258.40%8.50%
2014-02-258.60%8.40%
2014-01-218.50%8.60%
2013-12-208.40%8.50%
2013-11-268.10%8.40%
2013-10-228.00%8.10%
2013-09-247.70%8.00%
2013-08-207.80%7.70%
2013-07-238.10%7.80%
2013-06-258.40%8.10%
2013-05-218.20%8.40%
2013-04-238.20%8.20%
2013-03-268.10%8.20%
2013-02-267.90%8.10%8.00%
2013-01-227.80%7.90%
2012-12-217.90%7.80%
2012-11-207.90%7.90%
2012-10-238.00%7.90%
2012-09-257.80%8.00%
2012-08-217.50%7.80%
2012-07-247.50%7.50%
2012-06-267.60%7.50%
2012-05-227.60%7.60%
2012-04-247.40%7.60%
2012-03-017.50%7.40%
2012-02-017.50%7.50%
2012-01-017.50%7.50%
2011-12-017.60%7.50%
2011-11-017.60%7.60%
2011-10-017.70%7.60%
2011-09-017.80%7.70%
2011-08-017.80%7.80%
2011-07-017.80%7.80%
2011-06-017.90%7.80%
2011-05-018.00%7.90%
2011-04-018.10%8.00%
2011-03-018.10%8.10%
2011-02-018.10%8.10%
2011-01-018.10%8.10%
2010-12-018.00%8.10%
2010-11-018.10%8.00%
2010-10-018.20%8.10%
2010-09-018.30%8.20%
2010-08-018.40%8.30%
2010-07-018.40%8.40%
2010-06-018.50%8.40%
2010-05-018.60%8.50%
2010-04-018.80%8.60%
2010-03-018.80%8.80%
2010-02-018.90%8.80%
2010-01-018.90%8.90%
2009-12-018.70%8.90%
2009-11-018.60%8.70%
2009-10-018.60%8.60%
2009-09-018.60%8.60%
2009-08-018.60%8.60%
2009-07-018.40%8.60%
2009-06-018.10%8.40%
2009-05-017.70%8.10%
2009-04-017.20%7.70%
2009-03-016.90%7.20%
2009-02-016.70%6.90%
2009-01-016.60%6.70%
2008-12-016.60%6.60%
2008-11-016.50%6.60%
2008-10-016.50%6.50%
2008-09-016.40%6.50%
2008-08-016.30%6.40%
2008-07-016.20%6.30%
2008-06-016.10%6.20%
2008-05-016.10%6.10%
2008-04-016.20%6.10%
2008-03-016.40%6.20%
2008-02-016.60%6.40%
2008-01-016.70%6.60%
2007-12-016.90%6.70%
2007-11-016.90%6.90%
2007-10-016.90%6.90%
2007-09-016.90%6.90%
2007-08-016.70%6.90%
2007-07-016.70%6.70%
2007-06-016.70%6.70%
2007-05-016.90%6.70%
2007-04-017.10%6.90%
2007-03-017.10%7.10%
2007-02-017.20%7.10%
2007-01-017.40%7.20%
2006-12-017.60%7.40%
2006-11-017.70%7.60%
2006-10-017.70%7.70%
2006-09-017.70%7.70%
2006-08-017.80%7.70%
2006-07-017.80%7.80%
2006-06-017.80%7.80%
2006-05-017.80%7.80%
2006-04-018.00%7.80%
2006-03-018.10%8.00%
2006-02-018.30%8.10%
2006-01-018.20%8.30%
2005-12-018.10%8.20%
2005-11-018.10%8.10%
2005-10-018.20%8.10%
2005-09-018.30%8.20%
2005-08-018.30%8.30%
2005-07-018.30%8.30%
2005-06-018.40%8.30%
2005-05-018.60%8.40%
2005-04-018.70%8.60%
2005-03-018.80%8.70%
2005-02-018.70%8.80%
2005-01-018.60%8.70%
2004-12-018.60%8.60%
2004-11-018.60%8.60%
2004-10-018.70%8.60%
2004-09-018.80%8.70%
2004-08-019.00%8.80%
2004-07-019.10%9.00%
2004-06-019.10%9.10%
2004-05-019.10%9.10%
2004-04-018.90%9.10%
2004-03-018.90%8.90%
2004-02-018.90%8.90%
2004-01-018.90%8.90%
2003-12-018.90%8.90%
2003-11-018.90%8.90%
2003-10-018.90%8.90%
2003-09-019.00%8.90%
2003-08-019.10%9.00%
2003-07-019.20%9.10%
2003-06-019.20%9.20%
2003-05-019.10%9.20%
2003-04-019.00%9.10%
2003-03-018.90%9.00%
2003-02-018.90%8.90%
2003-01-018.90%8.90%
2002-12-019.00%8.90%
2002-11-019.00%9.00%
2002-10-019.10%9.00%
2002-09-019.10%9.10%
2002-08-019.10%9.10%
2002-07-019.20%9.10%
2002-06-019.20%9.20%
2002-05-019.20%9.20%
2002-04-019.10%9.20%
2002-03-019.10%9.10%
2002-02-019.10%9.10%
2002-01-019.10%9.10%
2001-12-019.20%9.10%
2001-11-019.10%9.20%
2001-10-019.10%9.10%
2001-09-019.00%9.10%
2001-08-019.00%9.00%
2001-07-019.00%9.00%
2001-06-019.10%9.00%
2001-05-019.20%9.10%
2001-04-019.30%9.20%
2001-03-019.20%9.30%
2001-02-019.20%9.20%
2001-01-019.30%9.20%
2000-12-019.40%9.30%
07:00
PPI (MoM) (Oct) -0,7%   0,4%
OpisProducer Price Index (PPI) measures a change in the prices of goods and services, over a span of time, either as they leave their place of production or as they enter the production process. PPI measures a change in the prices received by domestic producers for their outputs or the change in the prices paid by domestic producers for their intermediate inputs. A higher than expected reading should be taken as positive/bullish for the SEK , while a lower than expected reading should be taken as negative/bearish for the SEK.
PriorytetNiski
DataPoprzednia wartośćKolejna wartośćPrzewidywana wartość
2025-10-240.5%-0.7%
2025-09-251.1%0.5%
2025-08-26-0.6%1.1%
2025-07-25-0.5%-0.6%
2025-06-27-1.6%-0.5%
2025-05-26-3.0%-1.6%
2025-04-28-0.1%-3.0%
2025-03-251.7%-0.1%
2025-02-260.1%1.7%
2025-01-243.1%0.1%
2024-12-200.5%3.1%
2024-11-26-1.8%0.5%
2024-10-250.6%-1.8%
2024-09-25-1.4%0.6%
2024-08-27-0.4%-1.4%
2024-07-250.0%-0.4%
2024-06-260.5%0.0%
2024-05-240.6%0.5%
2024-04-250.0%0.6%
2024-03-260.3%0.0%
2024-02-28-1.6%0.3%
2024-01-251.4%-1.6%
2023-12-22-0.6%1.4%
2023-11-241.8%-0.6%
2023-10-25-0.7%1.8%
2023-09-26-0.6%-0.7%
2023-08-251.5%-0.6%-0.5%
2023-07-25-1.7%1.5%-1.4%
2023-06-27-1.0%-1.7%-1.0%
2023-05-26-0.1%-1.0%-2.7%
2023-04-25-1.0%-0.1%1.5%
2023-03-24-5.2%-1.0%
2023-02-282.1%-5.2%
2023-01-252.0%2.1%
2022-12-22-1.5%2.0%
2022-11-250.4%-1.5%
2022-10-253.3%0.4%
2022-09-27-1.5%3.3%
2022-08-262.5%-1.5%
2022-07-261.8%2.5%
2022-06-231.2%1.8%
2022-05-255.5%1.2%
2022-04-271.2%5.5%
2022-03-250.7%1.2%
2022-02-252.8%0.7%
2022-01-261.3%2.8%
2021-12-220.1%1.3%
2021-11-251.5%0.1%
2021-10-262.0%1.5%
2021-09-242.7%2.0%
2021-08-261.5%2.7%
2021-07-231.3%1.5%
2021-06-241.7%1.3%
2021-05-251.1%1.7%
2021-04-271.5%1.1%
2021-03-251.0%1.5%
2021-02-261.2%1.0%
2021-01-260.2%1.2%
2020-12-220.4%0.2%
2020-11-260.4%0.4%-0.4%
2020-10-23-0.2%0.4%
2020-09-25-0.7%-0.2%
2020-08-25-0.2%-0.7%
2020-07-24-0.9%-0.2%
2020-06-26-1.2%-0.9%
2020-05-27-1.2%-1.2%
2020-04-24-0.6%-1.2%
2020-03-25-1.0%-0.6%
2020-02-27-0.5%-1.0%0.0%
2020-01-280.3%-0.5%
2019-12-200.4%0.3%
2019-11-260.0%0.4%
2019-10-25-0.5%0.0%
2019-09-260.3%-0.5%
2019-08-27-0.2%0.3%
2019-07-250.0%-0.2%
2019-06-25-0.7%0.0%
2019-05-241.2%-0.7%
2019-04-260.2%1.2%
2019-03-260.8%0.2%
2019-02-28-0.6%0.8%
2019-01-250.0%-0.6%
2018-12-21-0.3%0.0%
2018-11-271.2%-0.3%
2018-10-250.0%1.2%
2018-09-250.9%0.0%
2018-08-240.8%0.9%
2018-07-251.4%0.8%
2018-06-260.6%1.4%
2018-05-241.2%0.6%
2018-04-26-0.5%1.2%
2018-03-270.8%-0.5%
2018-02-281.6%0.8%
2018-01-251.5%1.6%
2017-12-220.3%1.5%
2017-11-240.4%0.3%
2017-10-26-0.8%0.4%
2017-09-260.6%-0.8%
2017-08-25-0.8%0.6%
2017-07-250.0%-0.8%
2017-06-27-0.3%0.0%
2017-05-24-0.1%-0.3%
2017-04-27-0.8%-0.1%
2017-03-280.6%-0.8%
2017-02-282.1%0.6%
2017-01-261.3%2.1%
2016-12-222.0%1.3%
2016-11-24-0.1%2.0%
2016-10-251.0%-0.1%
2016-09-27-0.3%1.0%
2016-08-251.5%-0.3%
2016-07-260.0%1.5%
2016-06-28-0.9%0.0%
2016-05-260.8%-0.9%
2016-04-26-0.1%0.8%
2016-03-24-1.0%-0.1%
2016-02-25-0.7%-1.0%
2016-01-26-0.1%-0.7%
2015-12-22-0.3%-0.1%
2015-11-25-0.3%-0.3%
2015-10-270.2%-0.3%
2015-09-24-1.1%0.2%
2015-08-25-1.1%-1.1%
2015-07-230.3%-1.1%
2015-06-25-0.3%0.3%
2015-05-260.3%-0.3%
2015-04-281.1%0.3%
2015-03-260.2%1.1%
2015-02-27-0.3%0.2%
2015-01-27-0.4%-0.3%
2014-12-230.2%-0.4%
2014-11-25-0.3%0.2%
2014-10-281.0%-0.3%
2014-09-250.0%1.0%
2014-08-26-0.1%0.0%
2014-07-241.1%-0.1%
2014-06-26-0.4%1.1%-0.1%
2014-05-26-0.2%-0.4%-0.5%
2014-04-28-0.5%-0.2%
2014-03-25-0.1%-0.5%
2014-02-281.2%-0.1%-0.3%
2014-01-280.4%1.2%-0.1%
2013-12-20-0.30%0.4%0.20%
2013-11-260.70%-0.30%-0.50%
2013-10-24-0.30%0.70%-0.20%
2013-09-260.90%-0.30%0.50%
2013-08-260.40%0.90%0.30%
2013-07-25-0.10%0.40%0.20%
2013-06-25-1.10%-0.10%0.20%
2013-05-28-1.10%-1.10%0.20%
2013-04-25-0.40%-1.10%0.20%
2013-03-260.00%-0.40%-0.20%
2013-02-280.50%0.00%0.30%
2013-01-240.00%0.50%0.40%
2012-12-20-0.70%0.00%0.40%
2012-11-27-0.70%-0.70%0.40%
2012-10-25-0.50%-0.70%0.40%
2012-09-25-1.10%-0.50%0.40%
2012-08-270.20%-1.10%-0.30%
2012-07-26-0.50%0.20%-0.30%
2012-06-26-0.20%-0.50%-0.30%
2012-05-29-0.30%-0.20%0.20%
2012-04-260.40%-0.30%
2012-03-270.50%0.40%
2012-02-01-0.17%0.50%
2012-01-010.78%-0.17%
2011-12-01-0.26%0.78%
2011-11-01-0.68%-0.26%
2011-10-010.26%-0.68%
2011-09-010.43%0.26%
2011-08-010.09%0.43%
2011-07-01-0.85%0.09%
2011-06-010.00%-0.85%
2011-05-010.00%0.00%
2011-04-010.00%0.00%
2011-03-01-1.68%0.00%
2011-02-012.23%-1.68%
2011-01-010.78%2.23%
2010-12-01-0.69%0.78%
2010-11-010.43%-0.69%
2010-10-01-0.52%0.43%
2010-09-010.09%-0.52%
2010-08-011.31%0.09%
2010-07-010.00%1.31%
2010-06-01-0.17%0.00%
2010-05-01-1.46%-0.17%
2010-04-010.26%-1.46%
2010-03-012.01%0.26%
2010-02-010.18%2.01%
2010-01-010.88%0.18%
2009-12-01-0.35%0.88%
2009-11-01-0.87%-0.35%
2009-10-01-0.87%-0.87%
2009-09-010.70%-0.87%
2009-08-01-0.78%0.70%
2009-07-01-0.52%-0.78%
2009-06-01-0.85%-0.52%
2009-05-011.04%-0.85%
2009-04-01-0.17%1.04%
2009-03-010.87%-0.17%
2009-02-01-0.78%0.87%
2009-01-010.69%-0.78%
2008-12-010.00%0.69%
2008-11-010.61%0.00%
2008-10-010.09%0.61%
2008-09-010.97%0.09%
2008-08-010.98%0.97%
2008-07-01-0.27%0.98%
2008-06-010.72%-0.27%
2008-05-01-0.36%0.72%
2008-04-010.36%-0.36%
2008-03-011.55%0.36%
2008-02-010.00%1.55%
2008-01-010.36%0.00%
2007-12-01-0.09%0.36%
2007-11-010.73%-0.09%
2007-10-01-0.55%0.73%
2007-09-010.37%-0.55%
2007-08-010.37%0.37%
2007-07-01-0.28%0.37%
2007-06-010.46%-0.28%
2007-05-010.74%0.46%
2007-04-010.94%0.74%
2007-03-010.76%0.94%
2007-02-01-0.84%0.76%
2007-01-010.28%-0.84%
2006-12-010.66%0.28%
2006-11-01-0.19%0.66%
2006-10-010.95%-0.19%
2006-09-010.38%0.95%
2006-08-010.19%0.38%
2006-07-01-0.38%0.19%
2006-06-010.48%-0.38%
2006-05-010.97%0.48%
2006-04-01-0.29%0.97%
2006-03-010.78%-0.29%
2006-02-010.39%0.78%
2006-01-010.89%0.39%
2005-12-010.30%0.89%
2005-11-010.10%0.30%
2005-10-010.70%0.10%
2005-09-011.01%0.70%
2005-08-010.40%1.01%
2005-07-01-0.20%0.40%
2005-06-010.81%-0.20%
2005-05-010.72%0.81%
2005-04-010.83%0.72%
2005-03-010.94%0.83%
2005-02-01-1.23%0.94%
2005-01-010.10%-1.23%
2004-12-010.31%0.10%
2004-11-010.10%0.31%
2004-10-010.42%0.10%
2004-09-010.21%0.42%
2004-08-01-0.21%0.21%
2004-07-010.00%-0.21%
2004-06-010.63%0.00%
2004-05-010.95%0.63%
2004-04-010.32%0.95%
2004-03-010.32%0.32%
2004-02-01-0.53%0.32%
2004-01-010.11%-0.53%
2003-12-01-0.21%0.11%
2003-11-01-0.11%-0.21%
2003-10-010.32%-0.11%
2003-09-010.00%0.32%
2003-08-01-0.53%0.00%
2003-07-01-1.14%-0.53%
2003-06-01-1.03%-1.14%
2003-05-01-0.41%-1.03%
2003-04-01-0.10%-0.41%
2003-03-010.83%-0.10%
2003-02-011.25%0.83%
2003-01-010.00%1.25%
2002-12-010.42%0.00%
2002-11-01-0.21%0.42%
2002-10-010.63%-0.21%
2002-09-01-0.21%0.63%
2002-08-01-0.11%-0.21%
2002-07-010.00%-0.11%
2002-06-01-0.10%0.00%
2002-05-010.00%-0.10%
2002-04-01-0.42%0.00%
2002-03-010.42%-0.42%
2002-02-01-0.21%0.42%
2002-01-01-0.62%-0.21%
2001-12-010.42%-0.62%
2001-11-010.31%0.42%
2001-10-01-0.21%0.31%
2001-09-010.00%-0.21%
2001-08-010.31%0.00%
2001-07-01-0.52%0.31%
2001-06-010.52%-0.52%
2001-05-01-0.10%0.52%
2001-04-01-0.21%-0.10%
2001-03-010.00%-0.21%
2001-02-01-0.31%0.00%
2001-01-010.74%-0.31%
2000-12-011.06%0.74%
2000-11-010.64%1.06%
07:00
PPI (YoY) (Oct) 0,5%   0,4%
OpisProducer Price Index (PPI) measures a change in the prices of goods and services, over a span of time, either as they leave their place of production or as they enter the production process. PPI measures a change in the prices received by domestic producers for their outputs or the change in the prices paid by domestic producers for their intermediate inputs. A higher than expected reading should be taken as positive/bullish for the SEK , while a lower than expected reading should be taken as negative/bearish for the SEK.
PriorytetNiski
DataPoprzednia wartośćKolejna wartośćPrzewidywana wartość
2025-10-24-0.7%0.5%
2025-09-25-0.6%-0.7%
2025-08-26-3.1%-0.6%
2025-07-25-2.8%-3.1%
2025-06-27-2.4%-2.8%
2025-05-26-0.3%-2.4%
2025-04-283.4%-0.3%
2025-03-253.5%3.4%
2025-02-262.0%3.5%
2025-01-240.3%2.0%
2024-12-20-1.3%0.3%
2024-11-26-2.3%-1.3%
2024-10-251.2%-2.3%
2024-09-25-0.1%1.2%
2024-08-270.8%-0.1%1.2%
2024-07-252.6%0.8%
2024-06-260.9%2.6%
2024-05-24-0.6%0.9%
2024-04-25-1.3%-0.6%
2024-03-26-2.3%-1.3%
2024-02-28-7.7%-2.3%
2024-01-25-4.2%-7.7%
2023-12-22-3.7%-4.2%
2023-11-24-4.6%-3.7%
2023-10-25-5.9%-4.6%
2023-09-26-2.1%-5.9%
2023-08-25-3.1%-2.1%-6.0%
2023-07-25-2.1%-3.1%-5.9%
2023-06-271.3%-2.1%-2.9%
2023-05-263.5%1.3%-0.6%
2023-04-259.3%3.5%7.6%
2023-03-2411.8%9.3%
2023-02-2818.7%11.8%
2023-01-2519.5%18.7%
2022-12-2218.7%19.5%
2022-11-2520.6%18.7%
2022-10-2522.0%20.6%
2022-09-2720.4%22.0%
2022-08-2625.6%20.4%
2022-07-2624.4%25.6%
2022-06-2323.8%24.4%
2022-05-2524.5%23.8%
2022-04-2719.3%24.5%
2022-03-2519.8%19.3%
2022-02-2520.1%19.8%
2022-01-2616.9%20.1%
2021-12-2216.8%16.9%
2021-11-2517.2%16.8%
2021-10-2615.8%17.2%
2021-09-2413.5%15.8%
2021-08-269.6%13.5%
2021-07-237.9%9.6%
2021-06-245.6%7.9%
2021-05-253.8%5.6%
2021-04-271.3%3.8%
2021-03-25-0.8%1.3%
2021-02-26-2.7%-0.8%
2021-01-26-4.4%-2.7%
2020-12-22-4.2%-4.4%
2020-11-26-4.2%-4.2%-2.2%
2020-10-23-4.6%-4.2%
2020-09-25-4.9%-4.6%
2020-08-25-3.8%-4.9%
2020-07-24-3.8%-3.8%
2020-06-26-3.0%-3.8%
2020-05-27-3.6%-3.0%
2020-04-24-1.2%-3.6%
2020-03-25-0.4%-1.2%
2020-02-271.3%-0.4%0.7%
2020-01-281.2%1.3%
2019-12-200.9%1.2%
2019-11-260.3%0.9%
2019-10-251.4%0.3%
2019-09-262.0%1.4%
2019-08-272.5%2.0%
2019-07-253.5%2.5%
2019-06-254.9%3.5%
2019-05-246.3%4.9%
2019-04-266.3%6.3%
2019-03-265.6%6.3%
2019-02-285.6%5.6%
2019-01-257.9%5.6%
2018-12-219.5%7.9%
2018-11-2710.1%9.5%
2018-10-259.3%10.1%
2018-09-258.4%9.3%
2018-08-248.0%8.4%
2018-07-256.3%8.0%
2018-06-264.9%6.3%
2018-05-244.0%4.9%
2018-04-262.8%4.0%
2018-03-272.5%2.8%
2018-02-282.3%2.5%
2018-01-252.7%2.3%
2017-12-222.5%2.7%
2017-11-244.3%2.5%
2017-10-263.8%4.3%
2017-09-265.7%3.8%
2017-08-254.8%5.7%
2017-07-257.2%4.8%
2017-06-277.2%7.2%
2017-05-246.5%7.2%
2017-04-277.5%6.5%
2017-03-288.2%7.5%
2017-02-286.5%8.2%
2017-01-263.6%6.5%
2016-12-222.2%3.6%
2016-11-24-0.1%2.2%
2016-10-25-0.3%-0.1%
2016-09-27-1.1%-0.3%
2016-08-25-1.9%-1.1%
2016-07-26-4.5%-1.9%
2016-06-28-4.2%-4.5%
2016-05-26-3.7%-4.2%
2016-04-26-4.2%-3.7%
2016-03-24-3.1%-4.2%
2016-02-25-1.9%-3.1%
2016-01-26-1.5%-1.9%
2015-12-22-1.8%-1.5%
2015-11-25-1.4%-1.8%
2015-10-27-1.4%-1.4%
2015-09-24-0.6%-1.4%
2015-08-250.5%-0.6%
2015-07-231.6%0.5%
2015-06-252.4%1.6%
2015-05-262.3%2.4%
2015-04-281.9%2.3%
2015-03-260.2%1.9%
2015-02-27-0.1%0.2%
2015-01-271.3%-0.1%
2014-12-232.1%1.3%
2014-11-251.7%2.1%
2014-10-282.7%1.7%2.9%
2014-09-251.4%2.7%2.0%
2014-08-262.3%1.4%2.2%
2014-07-012.80%2.3%
2014-06-011.62%2.80%
2014-05-010.98%1.62%
2014-04-010.09%0.98%
2014-03-010.18%0.09%
2014-02-010.26%0.18%
2014-01-01-0.35%0.26%
2013-12-01-0.71%-0.35%
2013-11-01-1.14%-0.71%
2013-10-01-2.53%-1.14%
2013-09-01-2.77%-2.53%
2013-08-01-4.71%-2.77%
2013-07-01-4.89%-4.71%
2013-06-01-5.29%-4.89%
2013-05-01-4.43%-5.29%
2013-04-01-3.74%-4.43%
2013-03-01-2.90%-3.74%
2013-02-01-2.40%-2.90%
2013-01-01-3.08%-2.40%
2012-12-01-2.33%-3.08%
2012-11-01-1.89%-2.33%
2012-10-01-1.88%-1.89%
2012-09-01-1.11%-1.88%
2012-08-010.43%-1.11%
2012-07-010.34%0.43%
2012-06-010.00%0.34%
2012-05-010.17%0.00%
2012-04-010.51%0.17%
2012-03-010.09%0.51%
2012-02-01-2.10%0.09%
2012-01-010.26%-2.10%
2011-12-010.26%0.26%
2011-11-01-0.17%0.26%
2011-10-010.95%-0.17%
2011-09-010.17%0.95%
2011-08-01-0.17%0.17%
2011-07-011.04%-0.17%
2011-06-011.91%1.04%
2011-05-011.74%1.91%
2011-04-010.26%1.74%
2011-03-010.52%0.26%
2011-02-014.29%0.52%
2011-01-012.19%4.29%
2010-12-012.30%2.19%
2010-11-012.65%2.30%
2010-10-011.31%2.65%
2010-09-010.95%1.31%
2010-08-011.57%0.95%
2010-07-01-0.52%1.57%
2010-06-01-1.03%-0.52%
2010-05-01-1.71%-1.03%
2010-04-010.78%-1.71%
2010-03-010.34%0.78%
2010-02-01-0.78%0.34%
2010-01-01-1.72%-0.78%
2009-12-01-1.91%-1.72%
2009-11-01-1.56%-1.91%
2009-10-01-0.09%-1.56%
2009-09-010.87%-0.09%
2009-08-011.15%0.87%
2009-07-012.94%1.15%
2009-06-013.20%2.94%
2009-05-014.83%3.20%
2009-04-013.39%4.83%
2009-03-013.94%3.39%
2009-02-014.64%3.94%
2009-01-015.45%4.64%
2008-12-015.11%5.45%
2008-11-015.01%5.11%
2008-10-015.14%5.01%
2008-09-014.47%5.14%
2008-08-013.85%4.47%
2008-07-013.22%3.85%
2008-06-013.21%3.22%
2008-05-012.95%3.21%
2008-04-014.09%2.95%
2008-03-014.69%4.09%
2008-02-013.87%4.69%
2008-01-013.00%3.87%
2007-12-012.91%3.00%
2007-11-013.69%2.91%
2007-10-012.74%3.69%
2007-09-014.29%2.74%
2007-08-014.30%4.29%
2007-07-014.12%4.30%
2007-06-014.01%4.12%
2007-05-014.03%4.01%
2007-04-014.26%4.03%
2007-03-012.99%4.26%
2007-02-013.02%2.99%
2007-01-014.30%3.02%
2006-12-014.93%4.30%
2006-11-014.55%4.93%
2006-10-014.85%4.55%
2006-09-014.58%4.85%
2006-08-015.23%4.58%
2006-07-015.45%5.23%
2006-06-015.65%5.45%
2006-05-016.00%5.65%
2006-04-015.73%6.00%
2006-03-016.91%5.73%
2006-02-017.08%6.91%
2006-01-015.35%7.08%
2005-12-014.53%5.35%
2005-11-014.55%4.53%
2005-10-014.55%4.55%
2005-09-014.26%4.55%
2005-08-013.43%4.26%
2005-07-012.80%3.43%
2005-06-013.01%2.80%
2005-05-012.82%3.01%
2005-04-013.06%2.82%
2005-03-012.54%3.06%
2005-02-011.91%2.54%
2005-01-012.64%1.91%
2004-12-012.64%2.64%
2004-11-012.11%2.64%
2004-10-011.90%2.11%
2004-09-011.80%1.90%
2004-08-011.59%1.80%
2004-07-011.26%1.59%
2004-06-010.10%1.26%
2004-05-01-1.54%0.10%
2004-04-01-2.87%-1.54%
2004-03-01-3.28%-2.87%
2004-02-01-2.79%-3.28%
2004-01-01-1.04%-2.79%
2003-12-01-1.15%-1.04%
2003-11-01-0.52%-1.15%
2003-10-01-0.63%-0.52%
2003-09-01-0.32%-0.63%
2003-08-01-0.53%-0.32%
2003-07-01-0.11%-0.53%
2003-06-011.05%-0.11%
2003-05-011.99%1.05%
2003-04-012.41%1.99%
2003-03-012.09%2.41%
2003-02-011.68%2.09%
2003-01-010.21%1.68%
2002-12-01-0.42%0.21%
2002-11-01-0.42%-0.42%
2002-10-010.10%-0.42%
2002-09-01-0.73%0.10%
2002-08-01-0.52%-0.73%
2002-07-01-0.10%-0.52%
2002-06-01-0.63%-0.10%
2002-05-010.00%-0.63%
2002-04-01-0.10%0.00%
2002-03-010.10%-0.10%
2002-02-01-0.31%0.10%
2002-01-01-0.42%-0.31%
2001-12-010.95%-0.42%
2001-11-011.59%0.95%
2001-10-011.92%1.59%
2001-09-012.58%1.92%
2001-08-012.69%2.58%
2001-07-012.69%2.69%
2001-06-013.57%2.69%
2001-05-012.80%3.57%
2001-04-012.58%2.80%
2001-03-012.80%2.58%
2001-02-013.58%2.80%
2001-01-014.69%3.58%
2000-12-014.62%4.69%
2000-11-014.09%4.62%
07:00
German GDP (QoQ) (Q3) -0,2% 0,0% 0,0%
OpisGross Domestic Product (GDP) is the broadest measure of economic activity and is a key indicator of economic health. The quarterly percent changes in GDP show the growth rate of the economy as a whole.A higher than expected reading should be taken as positive/bullish for the EUR, while a lower than expected reading should be taken as negative/bearish for the EUR.
PriorytetWysoki
DataPoprzednia wartośćKolejna wartośćPrzewidywana wartość
2025-10-30-0.3%0.0%0.0%
2025-08-220.3%-0.3%-0.1%
2025-07-300.4%0.3%-0.1%
2025-05-23-0.2%0.4%0.2%
2025-04-30-0.2%-0.2%0.2%
2025-02-250.1%-0.2%-0.2%
2025-01-300.1%0.1%-0.1%
2024-11-220.2%0.1%0.2%
2024-10-30-0.3%0.2%-0.1%
2024-08-270.2%-0.3%-0.1%
2024-07-300.2%0.2%0.1%
2024-05-24-0.3%0.2%0.2%
2024-04-30-0.5%-0.3%0.1%
2024-02-23-0.1%-0.5%-0.3%
2024-01-30-0.1%-0.1%-0.3%
2023-11-240.0%-0.1%-0.1%
2023-10-300.1%0.0%-0.3%
2023-08-25-0.1%0.1%0.0%
2023-07-28-0.1%-0.1%0.1%
2023-05-25-0.4%-0.1%-0.1%
2023-04-280.8%-0.4%0.3%
2023-02-24-0.2%0.8%-0.2%
2023-01-300.5%-0.2%0.0%
2022-11-250.1%0.5%0.3%
2022-10-280.1%0.1%-0.2%
2022-08-250.2%0.1%0.0%
2022-07-290.8%0.2%0.1%
2022-05-25-0.3%0.8%0.2%
2022-04-29-0.3%-0.3%0.1%
2022-02-251.7%-0.3%-0.7%
2022-01-281.7%1.7%-0.3%
2021-11-252.0%1.7%1.8%
2021-10-291.9%2.0%2.2%
2021-08-24-1.8%1.9%1.5%
2021-07-30-2.1%-1.8%2.0%
2021-05-250.3%-2.1%-1.7%
2021-04-300.5%0.3%-1.5%
2021-02-248.5%0.5%0.1%
2021-01-298.5%8.5%
2020-11-24-9.7%8.5%8.2%
2020-10-30-9.8%-9.7%7.3%
2020-08-25-2.0%-9.8%-10.1%
2020-07-30-2.0%-2.0%-9.0%
2020-05-25-0.1%-2.0%-2.2%
2020-05-15-0.1%-0.1%-2.2%
2020-02-250.1%-0.1%0.1%
2020-02-140.2%0.1%0.1%
2019-11-22-0.2%0.2%0.1%
2019-11-14-0.2%-0.2%-0.1%
2019-08-270.4%-0.2%-0.1%
2019-08-140.4%0.4%-0.1%
2019-05-230.4%0.4%0.4%
2019-05-150.0%0.4%0.4%
2019-02-220.0%0.0%0.0%
2019-02-14-0.2%0.0%0.1%
2018-11-23-0.2%-0.2%-0.2%
2018-11-140.5%-0.2%-0.3%
2018-08-240.5%0.5%0.5%
2018-08-140.4%0.5%0.4%
2018-05-240.3%0.4%0.3%
2018-05-150.6%0.3%0.4%
2018-02-230.8%0.6%0.6%
2018-02-140.7%0.8%0.6%
2017-11-230.8%0.7%0.8%
2017-11-140.6%0.8%0.6%
2017-08-250.6%0.6%0.6%
2017-08-150.7%0.6%0.7%
2017-05-230.6%0.7%0.6%
2017-05-120.4%0.6%0.6%
2017-02-230.4%0.4%0.4%
2017-02-140.1%0.4%0.5%
2016-11-240.2%0.1%0.2%
2016-11-150.4%0.2%0.3%
2016-08-240.4%0.4%0.4%
2016-08-120.7%0.4%0.2%
2016-05-240.7%0.7%0.7%
2016-05-130.3%0.7%0.6%
2016-02-230.3%0.3%0.3%
2016-02-120.3%0.3%0.3%
2015-11-240.3%0.3%0.3%
2015-11-130.4%0.3%0.3%
2015-08-250.4%0.4%0.4%
2015-08-140.3%0.4%0.5%
2015-05-220.3%0.3%0.3%
2015-05-130.7%0.3%0.5%
2015-02-240.7%0.7%0.7%
2015-02-130.1%0.7%0.3%
2014-11-250.1%0.1%0.1%
2014-11-14-0.1%0.1%0.1%
2014-09-01-0.2%-0.1%-0.2%
2014-08-140.7%-0.2%-0.1%
2014-05-230.8%0.7%0.8%
2014-05-150.4%0.8%0.7%
2014-02-250.4%0.4%0.4%
2014-02-140.3%0.4%0.3%
2013-11-220.3%0.3%0.3%
2013-11-140.7%0.3%0.3%
2013-08-230.7%0.7%0.7%
2013-08-140.1%0.7%0.6%
2013-05-240.1%0.1%0.1%
2013-05-15-0.7%0.1%0.3%
2013-02-22-0.6%-0.7%-0.6%
2013-02-140.2%-0.6%-0.5%
2012-11-230.2%0.2%0.2%
2012-11-150.3%0.2%0.2%
2012-08-230.3%0.3%0.3%
2012-08-140.5%0.3%0.2%
2012-05-240.5%0.5%0.5%
2012-05-15-0.2%0.5%0.1%
2012-02-24-0.2%-0.2%-0.2%
2012-02-150.6%-0.2%-0.3%
2011-11-240.5%0.6%0.5%
2011-11-150.3%0.5%0.5%
2011-09-010.1%0.3%0.1%
2011-08-161.3%0.1%0.5%
2011-05-241.5%1.3%1.5%
2011-05-130.4%1.5%0.9%
2011-02-240.4%0.4%0.4%
2011-02-150.7%0.4%0.5%
2010-11-230.7%0.7%0.7%
2010-11-122.3%0.7%0.8%
2010-08-242.2%2.3%2.2%
2010-08-130.5%2.2%1.3%
2010-05-210.2%0.5%0.2%
2010-05-120.2%0.2%0.0%
2010-02-240.0%0.2%0.0%
2010-02-120.7%0.0%0.1%
2009-11-240.7%0.7%0.7%
2009-11-130.4%0.7%0.8%
2009-08-250.3%0.4%0.3%
2009-08-13-3.5%0.3%-0.3%
2009-05-26-3.8%-3.5%-3.8%
2009-05-15-2.2%-3.8%-3.0%
2009-02-25-2.1%-2.2%-2.1%
2009-02-13-0.5%-2.1%-1.8%
2008-11-25-0.5%-0.5%-0.5%
2008-08-26-0.5%-0.5%-0.5%
2008-08-141.5%-0.5%-0.8%
2008-05-150.3%1.5%0.7%
2008-02-260.3%0.3%0.3%
2008-02-1400.3%0.3%
07:00
German GDP (YoY) (Q3) 0,3% 0,3% 0,3%
OpisGross Domestic Product (GDP) is the broadest measure of economic activity and is a key indicator of economic health. The quarterly percent changes in GDP show the growth rate of the economy as a whole.A higher than expected reading should be taken as positive/bullish for the EUR, while a lower than expected reading should be taken as negative/bearish for the EUR.
Priorytet Średni
DataPoprzednia wartośćKolejna wartośćPrzewidywana wartość
2025-10-300.2%0.3%0.3%
2025-08-220.3%0.2%0.4%
2025-07-300.0%0.3%0.2%
2025-05-23-0.2%0.0%-0.2%
2025-04-30-0.2%-0.2%-0.2%
2025-02-25-0.3%-0.2%-0.2%
2025-01-30-0.3%-0.3%0.0%
2024-11-22-0.2%-0.3%-0.2%
2024-10-30-0.3%-0.2%-0.3%
2024-08-27-0.2%-0.3%-0.1%
2024-07-30-0.2%-0.2%0.0%
2024-05-24-0.2%-0.2%-0.2%
2024-04-30-0.2%-0.2%-0.2%
2024-02-23-0.4%-0.2%-0.2%
2024-01-30-0.4%-0.4%-0.2%
2023-11-240.1%-0.4%-0.3%
2023-10-300.0%0.1%-0.7%
2023-08-25-0.2%0.0%-0.2%
2023-07-28-0.2%-0.2%
2023-05-250.3%-0.2%0.2%
2023-04-280.2%0.3%0.8%
2023-02-240.5%0.2%0.5%
2023-01-301.3%0.5%0.8%
2022-11-251.7%1.3%1.1%
2022-10-281.7%1.7%0.7%
2022-08-251.5%1.7%1.5%
2022-07-293.9%1.5%1.8%
2022-05-251.8%3.9%4.0%
2022-04-291.8%1.8%3.8%
2022-02-252.8%1.8%1.4%
2022-01-282.9%2.8%1.8%
2021-11-2510.4%2.9%2.5%
2021-10-2910.3%10.4%2.4%
2021-08-24-3.4%10.3%9.6%
2021-07-30-3.4%-3.4%9.6%
2021-05-25-3.3%-3.4%-3.3%
2021-04-30-2.3%-3.3%-3.6%
2021-02-24-3.9%-2.3%-2.9%
2021-01-29-3.9%-3.9%-3.4%
2020-11-24-11.3%-3.9%-4.1%
2020-10-30-11.3%-11.3%-5.2%
2020-08-25-1.8%-11.3%-11.7%
2020-07-30-1.8%-1.8%-10.9%
2020-05-250.2%-1.8%-1.9%
2020-05-150.2%0.2%-1.6%
2020-02-251.0%0.2%0.3%
2020-02-141.1%1.0%0.2%
2019-11-220.3%1.1%0.5%
2019-11-14-0.1%0.3%0.9%
2019-08-270.7%-0.1%0.4%
2019-08-140.6%0.7%-0.3%
2019-05-230.6%0.6%0.6%
2019-05-150.9%0.6%0.7%
2019-02-220.9%0.9%0.9%
2019-02-140.9%0.9%0.9%
2018-11-231.1%0.9%1.1%
2018-11-142.3%1.1%1.3%
2018-08-242.3%2.3%2.3%
2018-08-141.4%2.3%2.5%
2018-05-241.6%1.4%1.6%
2018-05-152.3%1.6%1.8%
2018-02-232.3%2.3%2.3%
2018-02-142.2%2.3%2.3%
2017-11-232.3%2.2%2.6%
2017-11-141.0%2.3%2.3%
2017-08-250.8%1.0%0.8%
2017-08-152.0%0.8%1.9%
2017-05-231.7%2.0%1.7%
2017-05-121.8%1.7%1.7%
2017-02-231.2%1.8%1.2%
2017-02-141.5%1.2%1.7%
2016-11-241.5%1.5%1.7%
2016-11-153.1%1.5%1.8%
2016-08-243.1%3.1%3.1%
2016-08-121.5%3.1%1.5%
2016-05-241.3%1.5%1.6%
2016-05-132.1%1.3%1.5%
2016-02-232.1%2.1%2.1%
2016-02-121.7%2.1%2.3%
2015-11-241.8%1.7%1.8%
2015-11-131.6%1.8%1.8%
2015-08-251.6%1.6%1.6%
2015-08-141.1%1.6%1.5%
2015-05-221.1%1.1%1.0%
2015-05-131.6%1.1%1.2%
2015-02-241.6%1.6%1.5%
2015-02-131.2%1.6%1.0%
2014-11-251.2%1.2%1.2%
2014-11-141.0%1.2%1.0%
2014-09-010.8%1.0%0.8%
2014-08-142.5%0.8%1.5%
2014-05-232.5%2.5%2.3%
2014-05-151.3%2.5%2.2%
2014-02-251.3%1.3%1.3%
2014-02-141.1%1.3%1.3%
2013-11-221.1%1.1%1.1%
2013-11-140.9%1.1%0.7%
2013-08-230.9%0.9%0.9%
2013-08-14-1.6%0.9%0.3%
2013-05-24-1.4%-1.6%-1.4%
2013-05-150.1%-1.4%0.2%
2013-02-220.1%0.1%0.1%
2013-02-140.4%0.1%0.2%
2012-11-230.4%0.4%0.4%
2012-11-150.5%0.4%0.8%
2012-08-230.5%0.5%0.5%
2012-08-141.7%0.5%1.0%
2012-05-241.7%1.7%1.7%
2012-05-1501.7%0.8%
07:00
Leading Indicators (Sep) 115,49%   114,20%
OpisThe Leading Indicators Index is a composite index based on 10 economic indicators, that is designed to predict the future direction of the economy. The report tends to have a limited impact because most of the indicators used in the calculation are released previously.A higher than expected reading should be taken as positive/bullish for the CAD, while a lower than expected reading should be taken as negative/bearish for the CAD.
PriorytetNiski
DataPoprzednia wartośćKolejna wartośćPrzewidywana wartość
2025-10-21113.62%115.50%
2025-09-23112.68%113.62%
2025-08-26111.29%112.68%
2025-07-22112.73%111.29%
2025-06-24113.16%112.73%
2025-05-27114.12%113.16%
2025-04-22114.43%114.12%
2025-03-25113.31%114.43%
2025-02-25114.70%113.31%
2025-01-28114.00%114.70%
2024-12-17113.90%114.00%
2024-11-26112.80%113.90%
2024-10-22113.60%112.80%
2024-09-25112.80%113.60%
2024-08-20111.90%112.80%
2024-07-23113.00%111.90%
2024-06-25110.40%113.00%
2024-05-21112.80%110.40%
2024-04-23110.80%112.80%
2024-03-26111.34%110.80%
2024-02-20111.80%111.34%
2024-01-23112.00%111.80%
2023-12-19111.60%112.00%
2023-11-21110.90%111.60%
2023-10-24110.40%110.90%
2023-09-26108.30%110.40%
2023-08-22108.40%108.30%
2023-07-250108.40%
07:45
French Consumer Confidence (Nov) 90   89
OpisFrench Consumer Confidence measures the level of consumer confidence in economic activity. It is a leading indicator as it can predict consumer spending, which plays a major role in overall economic activity. Higher readings point to higher consumer optimism.A higher than expected reading should be taken as positive/bullish for the EUR, while a lower than expected reading should be taken as negative/bearish for the EUR.
PriorytetNiski
DataPoprzednia wartośćKolejna wartośćPrzewidywana wartość
2025-10-24889087
2025-09-25878887
2025-08-26888790
2025-07-25888888
2025-06-25888889
2025-05-23918893
2025-04-24929191
2025-03-26939294
2025-02-26929393
2025-01-28899290
2025-01-08908989
2024-11-279390
2024-10-25959394
2024-09-25939592
2024-08-28919392
2024-07-26909190
2024-06-26909089
2024-05-29909091
2024-04-26919092
2024-03-27909190
2024-02-27919092
2024-01-26899190
2023-12-228889
2023-11-28848884
2023-10-27838483
2023-09-27858384
2023-08-29858585
2023-07-26858586
2023-06-28838584
2023-05-26838384
2023-04-26828381
2023-03-29828281
2023-02-24838280
2023-01-27818383
2023-01-04838184
2022-11-25828383
2022-10-26798277
2022-09-28827980
2022-08-26808279
2022-07-27828080
2022-06-28858284
2022-05-25878589
2022-04-27908792
2022-03-29979094
2022-02-249997100
2022-01-261009998
2022-01-059810097
2021-11-26999898
2021-10-2710199101
2021-09-2899101100
2021-08-2710099100
2021-07-28103100102
2021-06-3098103
2021-06-299898100
2021-05-26959897
2021-04-28949593
2021-03-30919491
2021-02-25929192
2021-01-27959294
2021-01-06899591
2020-11-26948992
2020-10-28959493
2020-09-29959593
2020-08-26949594
2020-07-29969499
2020-06-26939695
2020-05-27959392
2020-04-281039583
2020-03-2710410392
2020-02-26104104103
2020-01-29102104102
2020-01-08105102104
2019-11-27104105103
2019-10-29104104104
2019-09-25103104102
2019-08-27102103102
2019-07-26101102101
2019-06-2699101100
2019-05-28969997
2019-04-26969697
2019-03-27959696
2019-02-26929592
2019-01-29869288
2019-01-09918690
2018-11-27959194
2018-10-26949594
2018-09-26969497
2018-08-28979697
2018-07-26979798
2018-06-279997100
2018-05-2910199101
2018-04-25100101100
2018-03-28100100100
2018-02-27104100103
2018-01-26105104106
2018-01-05103105103
2017-11-28100103101
2017-10-27101100101
2017-09-27103101103
2017-08-25104103103
2017-07-26108104108
2017-06-28103108103
2017-05-30100103101
2017-04-26100100100
2017-03-29100100100
2017-02-24100100100
2017-01-2799100100
2017-01-04999999
2016-11-25989998
2016-10-26979898
2016-09-28979797
2016-08-269697
2016-07-27979696
2016-06-28989797
2016-05-27949894
2016-04-27949495
2016-03-25959496
2016-02-24979597
2016-01-27969796
2016-01-06969695
2015-11-25969695
2015-10-28979697
2015-09-25949794
2015-09-04939494
2015-07-29949394
2015-06-26949493
2015-05-27949495
2015-04-28939494
2015-03-27929393
2015-02-25909291
2015-01-28909091
2015-01-06889088
2014-11-26858886
2014-10-29868586
2014-09-26868686
2014-09-05868685
2014-07-30868686
2014-06-26858685
2014-05-27858585
2014-04-29888588
2014-03-27858885
2014-02-27868586
2014-01-28858685
2014-01-07848584
2013-11-27858485
2013-10-29858585
2013-09-26848585
2013-09-06828483
2013-07-26798279
2013-06-27797981
2013-05-28837985
2013-04-26848384
2013-03-26868485
2013-02-27868686
2013-01-29868686
2012-12-27848684
2012-11-27848483
2012-10-26858484
2012-09-26878586
2012-07-27898790
2012-06-26908989
2012-05-25899089
2012-04-24878987
2012-03-27828783
2012-02-24818282
2012-01-26808181
2012-01-05808077
2011-11-25828079
2011-10-25808278
2011-09-23868083
2011-07-26838681
2011-06-24848383
2011-05-26838482
2011-04-27838382
2011-03-25858384
2011-02-24858584
2011-01-27868585
2011-01-04898683
2010-12-0191.0089
2010-11-0190.0091.00
2010-10-0189.0090.00
2010-09-0187.0089.00
2010-08-0187.0087.00
2010-07-0188.0087.00
2010-06-0189.0088.00
2010-05-0191.0089.00
2010-04-0192.0091.00
2010-03-0194.0092.00
2010-02-0194.0094.00
2010-01-0193.0094.00
2009-12-0191.0093.00
2009-11-0190.0091.00
2009-10-0189.0090.00
2009-09-0189.0089.00
2009-08-0190.0089.00
2009-07-0187.0090.00
2009-06-0186.0087.00
2009-05-0185.0086.00
2009-04-0184.0085.00
2009-03-0185.0084.00
2009-02-0183.0085.00
2009-01-0184.0083.00
2008-12-0182.0084.00
2008-11-0184.0082.00
2008-10-0182.0084.00
2008-09-0182.0082.00
2008-08-0182.0082.00
2008-07-0185.0082.00
2008-06-0188.0085.00
2008-05-0188.0088.00
2008-04-0190.0088.00
2008-03-0190.0090.00
2008-02-0194.0090.00
2008-01-0194.0094.00
2007-12-0199.0094.00
2007-11-01101.0099.00
2007-10-01103.00101.00
2007-09-01106.00103.00
2007-08-01108.00106.00
2007-07-01107.00108.00
2007-06-01101.00107.00
2007-05-01100.00101.00
2007-04-0199.00100.00
2007-03-0199.0099.00
2007-02-0198.0099.00
2007-01-0199.0098.00
2006-12-0199.0099.00
2006-11-0199.0099.00
2006-10-0198.0099.00
2006-09-0198.0098.00
2006-08-0196.0098.00
2006-07-0195.0096.00
2006-06-0196.0095.00
2006-05-0197.0096.00
2006-04-0198.0097.00
2006-03-0197.0098.00
2006-02-0195.0097.00
2006-01-0192.0095.00
2005-12-0192.0092.00
2005-11-0193.0092.00
2005-10-0193.0093.00
2005-09-0194.0093.00
2005-08-0194.0094.00
2005-07-0195.0094.00
2005-06-0197.0095.00
2005-05-0197.0097.00
2005-04-0199.0097.00
2005-03-0197.0099.00
2005-02-0199.0097.00
2005-01-01100.0099.00
2004-12-01101.00100.00
2004-11-01101.00101.00
2004-10-01100.00101.00
2004-09-0199.00100.00
2004-08-0199.0099.00
2004-07-01100.0099.00
2004-06-01101.00100.00
2004-05-0199.00101.00
2004-04-0198.0099.00
2004-03-0199.0098.00
2004-02-0198.0099.00
2004-01-0198.0098.00
2003-12-0198.0098.00
2003-11-0199.0098.00
2003-10-01100.0099.00
2003-09-01100.00100.00
2003-08-01100.00100.00
2003-07-01100.00100.00
2003-06-0199.00100.00
2003-05-0198.0099.00
2003-04-01101.0098.00
2003-03-01104.00101.00
2003-02-01107.00104.00
2003-01-01107.00107.00
2002-12-01107.00107.00
2002-11-01106.00107.00
2002-10-01107.00106.00
2002-09-01108.00107.00
2002-08-01110.00108.00
2002-07-01111.00110.00
2002-06-01108.00111.00
2002-05-01110.00108.00
2002-04-01110.00110.00
2002-03-01111.00110.00
2002-02-01111.00111.00
2002-01-01111.00111.00
2001-12-01110.00111.00
2001-11-01110.00110.00
2001-10-01112.00110.00
2001-09-01113.00112.00
2001-08-01113.00113.00
2001-07-01115.00113.00
2001-06-01119.00115.00
2001-05-01120.00119.00
2001-04-01122.00120.00
2001-03-01124.00122.00
2001-02-01121.00124.00
2001-01-01118.00121.00
2000-12-01118.00118.00
2000-11-01117.00118.00
08:00
Industrial Production (YoY) (Oct) 16,41%   14,50%
OpisIndustrial Production measures the change in the total inflation-adjusted value of output produced by manufacturers, mines, and utilities.A higher than expected reading should be taken as positive/bullish for the TWD, while a lower than expected reading should be taken as negative/bearish for the TWD.
PriorytetNiski
DataPoprzednia wartośćKolejna wartośćPrzewidywana wartość
2025-10-2313.67%15.48%
2025-09-2418.73%13.67%
2025-08-2618.32%18.73%
2025-07-2322.10%18.32%
2025-06-2423.71%22.10%
2025-05-2312.76%23.71%
2025-04-2318.21%12.76%
2025-03-254.87%18.21%
2025-02-2519.76%4.87%
2025-01-2310.20%19.76%
2024-12-238.81%10.20%
2024-11-2511.15%8.81%
2024-10-2312.54%11.15%
2024-09-2513.01%12.54%
2024-08-2312.82%13.01%
2024-07-2315.73%12.82%
2024-06-2414.48%15.73%
2024-05-234.20%14.48%
2024-04-23-1.31%4.20%
2024-03-2515.61%-1.31%
2024-02-29-3.83%15.61%
2024-01-23-2.05%-3.83%
2023-12-25-2.27%-2.05%
2023-11-23-6.93%-2.27%
2023-10-23-10.81%-6.93%
2023-09-23-15.46%-10.81%
2023-08-23-17.25%-15.46%
2023-07-24-15.71%-17.25%
2023-06-26-22.60%-15.71%
2023-05-23-16.03%-22.60%
2023-04-24-7.66%-16.03%-3.00%
2023-03-23-20.95%-7.66%
2023-02-23-8.00%-20.95%
2023-02-01-5.55%-8.00%
2022-12-23-4.27%-5.55%
2022-11-23-4.49%-4.27%
2022-10-243.26%-4.49%
2022-09-231.12%3.26%
2022-08-230.54%1.12%
2022-07-254.14%0.54%
2022-06-236.42%4.14%
2022-05-232.15%6.42%
2022-04-259.47%2.15%
2022-03-238.39%9.47%
2022-02-239.98%8.39%
2022-01-2411.37%9.98%
2021-12-2311.60%11.37%
2021-11-2311.61%11.60%
2021-10-2513.43%11.61%
2021-09-2714.36%13.43%
2021-08-2318.00%14.36%
2021-07-2316.88%18.00%
2021-06-2314.10%16.88%
2021-05-2416.06%14.10%
2021-04-232.52%16.06%
2021-03-2319.04%2.52%
2021-02-2510.29%19.04%
2021-01-257.56%10.29%
2020-12-236.44%7.56%
2020-11-2311.62%6.44%
2020-10-233.60%11.62%
2020-09-232.75%3.60%
2020-08-247.19%2.75%
2020-07-231.51%7.19%
2020-06-233.51%1.51%
2020-05-2511.18%3.51%
2020-04-2320.69%11.18%
2020-03-23-2.11%20.69%
2020-02-246.29%-2.11%
2020-01-221.79%6.29%
2019-12-23-2.64%1.79%
2019-11-25-0.75%-2.64%
2019-10-232.35%-0.75%
2019-09-233.77%2.35%
2019-08-23-0.49%3.77%
2019-07-23-2.58%-0.49%
2019-06-241.41%-2.58%
2019-05-23-9.38%1.41%
2019-04-23-1.96%-9.38%
2019-03-25-1.86%-1.96%
2019-02-26-1.06%-1.86%
2019-01-232.36%-1.06%
2018-12-248.32%2.36%
2018-11-231.64%8.32%
2018-10-231.07%1.64%
2018-09-254.43%1.07%
2018-08-230.51%4.43%
2018-07-237.05%0.51%
2018-06-258.53%7.05%
2018-05-233.09%8.53%
2018-04-23-1.93%3.09%
2018-03-2310.86%-1.93%
2018-03-051.20%10.86%
2018-01-231.34%1.20%
2017-12-222.85%1.34%
2017-11-234.77%2.85%
2017-10-233.25%4.77%
2017-09-222.38%3.25%
2017-08-233.14%2.38%
2017-07-240.85%3.14%
2017-06-23-0.15%0.85%
2017-05-233.22%-0.15%
2017-04-2410.64%3.22%
2017-03-232.77%10.64%
2017-02-236.25%2.77%
2017-01-238.83%6.25%
2016-12-233.70%8.83%
2016-11-235.02%3.70%
2016-10-247.74%5.02%
2016-09-27-0.31%7.74%
2016-08-230.88%-0.31%
2016-07-221.89%0.88%
2016-06-23-4.06%1.89%
2016-05-23-3.57%-4.06%
2016-04-22-3.65%-3.57%
2016-03-23-5.65%-3.65%-5.45%
2016-02-26-6.17%-5.65%-5.90%
2016-01-22-4.94%-6.17%-6.80%
2015-12-23-6.15%-4.94%-5.55%
2015-11-23-5.32%-6.15%-5.60%
2015-10-23-5.46%-5.32%-5.80%
2015-09-23-2.99%-5.46%-2.90%
2015-08-24-1.35%-2.99%-2.30%
2015-07-23-3.18%-1.35%-3.30%
2015-06-241.06%-3.18%1.21%
2015-05-256.49%1.06%4.10%
2015-04-233.32%6.49%5.51%
2015-03-238.14%3.32%1.20%
2015-03-047.33%8.14%8.05%
2015-01-236.86%7.33%4.48%
2014-12-238.97%6.86%
2014-11-2410.30%8.97%7.50%
2014-10-237.03%10.30%6.70%
2014-09-236.08%7.03%6.83%
2014-08-258.63%6.08%5.05%
2014-07-235.42%8.63%7.20%
2014-06-235.29%5.42%2.70%
2014-05-233.05%5.29%3.50%
2014-04-236.83%3.05%1.30%
2014-03-24-1.78%6.83%3.50%
2014-02-245.50%-1.78%-3.83%
2014-01-23-0.50%5.50%2.02%
2013-12-230.61%-0.50%0.90%
2013-11-251.06%0.61%1.10%
2013-10-23-0.57%1.06%0.10%
2013-09-26-0.40%-0.57%2.00%
2013-08-23-0.40%-0.40%-0.30%
2013-07-23-0.07%-0.40%2.31%
2013-06-24-0.88%-0.07%-1.18%
2013-05-23-3.00%-0.88%-0.70%
2013-04-23-11.45%-3.00%1.80%
2013-03-2519.05%-11.45%-9.55%
2013-02-272.05%19.05%16.80%
2013-01-235.87%2.05%6.35%
2012-12-244.84%5.87%5.40%
2012-11-233.00%4.84%2.20%
2012-10-231.37%3.00%3.50%
2012-09-240.13%1.37%-0.50%
2012-08-23-2.44%0.13%-1.70%
2012-07-23-0.21%-2.44%0.50%
2012-06-25-1.80%-0.21%-2.50%
2012-05-23-3.43%-1.80%-1.50%
2012-04-238.40%-3.43%-6.80%
2012-03-23-16.80%8.40%10.10%
2012-02-23-8.10%-16.80%-6.30%
2012-01-20-4.70%-8.10%-2.00%
2011-12-231.00%-4.70%2.20%
2011-11-231.80%1.00%2.50%
2011-10-244.00%1.80%3.80%
2011-09-233.90%4.00%4.00%
2011-08-233.80%3.90%4.80%
2011-07-257.60%3.80%8.10%
2011-06-237.20%7.60%4.60%
2011-05-2313.70%7.20%11.50%
2011-04-2513.30%13.70%11.00%
2011-03-2317.40%13.30%15.50%
2011-02-2318.20%17.40%16.30%
2011-01-2419.40%18.20%18.70%
2010-12-2314.40%19.40%12.20%
2010-11-2312.20%14.40%14.00%
2010-10-2523.40%12.20%17.00%
2010-09-0119.73%23.40%
2010-08-0121.09%19.73%
2010-07-0128.47%21.09%
2010-06-0128.86%28.47%
2010-05-0136.00%28.86%
2010-04-0130.30%36.00%
2010-03-0162.74%30.30%
2010-02-0147.32%62.74%
2010-01-0129.40%47.32%
2009-12-016.60%29.40%
2009-11-010.94%6.60%
2009-10-01-10.18%0.94%
2009-09-01-7.28%-10.18%
2009-08-01-9.98%-7.28%
2009-07-01-18.09%-9.98%
2009-06-01-18.69%-18.09%
2009-05-01-23.02%-18.69%
2009-04-01-23.72%-23.02%
2009-03-01-40.36%-23.72%
2009-02-01-30.84%-40.36%
2009-01-01-27.30%-30.84%
2008-12-01-12.15%-27.30%
2008-11-01-0.14%-12.15%
2008-10-011.58%-0.14%
2008-09-012.14%1.58%
2008-08-015.18%2.14%
2008-07-015.89%5.18%
2008-06-0111.64%5.89%
2008-05-0110.14%11.64%
2008-04-0116.35%10.14%
2008-03-0112.91%16.35%
2008-02-0113.30%12.91%
2008-01-0112.75%13.30%
2007-12-0115.91%12.75%
2007-11-017.44%15.91%
2007-10-019.34%7.44%
2007-09-0112.71%9.34%
2007-08-017.57%12.71%
2007-07-017.25%7.57%
2007-06-013.73%7.25%
2007-05-01-0.08%3.73%
2007-04-01-3.60%-0.08%
2007-03-015.41%-3.60%
2007-02-01-1.21%5.41%
2007-01-011.80%-1.21%
2006-12-011.12%1.80%
2006-11-013.34%1.12%
2006-10-015.19%3.34%
2006-09-017.07%5.19%
2006-08-015.15%7.07%
2006-07-018.15%5.15%
2006-06-015.38%8.15%
2006-05-017.67%5.38%
2006-04-0113.26%7.67%
2006-03-013.02%13.26%
2006-02-016.32%3.02%
2006-01-015.22%6.32%
2005-12-015.74%5.22%
2005-11-015.35%5.74%
2005-10-016.83%5.35%
2005-09-010.01%6.83%
2005-08-012.48%0.01%
2005-07-010.40%2.48%
2005-06-012.14%0.40%
2005-05-011.48%2.14%
2005-04-01-11.35%1.48%
2005-03-0115.70%-11.35%
2005-02-010.03%15.70%
2005-01-016.40%0.03%
2004-12-013.32%6.40%
2004-11-018.01%3.32%
2004-10-016.86%8.01%
2004-09-017.65%6.86%
2004-08-0114.51%7.65%
2004-07-0114.28%14.51%
2004-06-0113.56%14.28%
2004-05-0115.90%13.56%
2004-04-0128.04%15.90%
2004-03-01-0.94%28.04%
2004-02-0118.72%-0.94%
2004-01-0111.74%18.72%
2003-12-0112.62%11.74%
2003-11-0110.90%12.62%
2003-10-017.06%10.90%
2003-09-018.68%7.06%
2003-08-015.82%8.68%
2003-07-010.90%5.82%
2003-06-014.30%0.90%
2003-05-015.84%4.30%
2003-04-0111.62%5.84%
2003-03-0111.67%11.62%
2003-02-0112.73%11.67%
2003-01-019.44%12.73%
2002-12-018.39%9.44%
2002-11-0114.09%8.39%
2002-10-018.57%14.09%
2002-09-0114.30%8.57%
2002-08-019.07%14.30%
2002-07-0110.27%9.07%
2002-06-019.52%10.27%
2002-05-01-0.60%9.52%
2002-04-01-14.23%-0.60%
2002-03-018.85%-14.23%
2002-02-01-9.89%8.85%
2002-01-01-9.40%-9.89%
2001-12-01-8.38%-9.40%
2001-11-01-16.03%-8.38%
2001-10-01-9.34%-16.03%
2001-09-01-12.57%-9.34%
2001-08-01-13.15%-12.57%
2001-07-01-7.70%-13.15%
2001-06-01-7.27%-7.70%
2001-05-01-3.21%-7.27%
2001-04-0112.69%-3.21%
2001-03-01-12.14%12.69%
2001-02-01-0.21%-12.14%
2001-01-012.82%-0.21%
2000-12-016.64%2.82%
2000-11-0114.73%6.64%
08:00
Spanish PPI (YoY) (Oct) 0,3%   0,7%
OpisThe Producer Price Index (PPI) measures the change in the price of goods sold by manufacturers. It is a leading indicator of consumer price inflation, which accounts for the majority of overall inflation.A higher than expected reading should be taken as positive/bullish for the EUR, while a lower than expected reading should be taken as negative/bearish for the EUR.
PriorytetNiski
DataPoprzednia wartośćKolejna wartośćPrzewidywana wartość
2025-10-24-1.6%0.3%
2025-09-240.4%-1.6%
2025-08-250.8%0.4%
2025-07-240.0%0.8%
2025-06-251.6%0.0%
2025-05-264.6%1.6%
2025-04-246.6%4.6%
2025-03-252.6%6.6%
2025-02-262.3%2.6%
2025-01-240.9%2.3%
2024-12-26-3.9%0.9%
2024-11-25-5.2%-3.9%
2024-10-25-1.3%-5.2%
2024-09-25-1.6%-1.3%
2024-08-26-3.2%-1.6%
2024-07-24-4.5%-3.2%
2024-06-25-6.7%-4.5%
2024-05-24-8.2%-6.7%
2024-04-25-8.5%-8.2%
2024-03-25-3.9%-8.5%
2024-02-26-6.3%-3.9%
2024-01-25-7.6%-6.3%
2023-12-26-7.7%-7.6%
2023-11-24-8.5%-7.7%
2023-10-25-9.9%-8.5%
2023-09-25-8.6%-9.9%
2023-08-25-8.1%-8.6%-10.1%
2023-07-24-6.8%-8.1%-10.2%
2023-06-26-4.5%-6.8%-4.5%
2023-05-25-1.4%-4.5%
2023-04-258.0%-1.4%2.8%
2023-03-248.2%8.0%
2023-02-2414.9%8.2%
2023-01-2520.7%14.9%
2022-11-2535.6%20.7%
2022-10-2542.9%35.6%
2022-08-2543.1%42.9%
2022-07-2643.6%43.1%
2022-06-2745.0%43.6%
2022-05-2547.0%45.0%
2022-04-2541.2%47.0%
2022-03-2535.7%41.2%
2022-02-2535.2%35.7%
2022-01-2532.2%35.2%
2021-12-2231.9%32.2%
2021-11-2523.8%31.9%
2021-10-2618.0%23.8%
2021-09-2715.6%18.0%
2021-08-2515.3%15.6%
2021-06-2512.8%15.3%
2021-05-256.4%12.8%
2021-04-260.8%6.4%
2021-03-250.9%0.8%
2021-02-25-1.4%0.9%
2021-01-26-2.8%-1.4%
2020-12-23-4.1%-2.8%
2020-11-25-3.3%-4.1%
2020-10-26-3.5%-3.3%
2020-09-25-4.8%-3.5%
2020-08-25-5.9%-4.8%
2020-07-24-8.8%-5.9%
2020-06-25-8.4%-8.8%
2020-05-25-5.0%-8.4%
2020-04-24-2.2%-5.0%
2020-03-25-0.9%-2.2%
2020-02-25-1.8%-0.9%
2020-01-24-2.3%-1.8%
2019-12-23-2.8%-2.3%
2019-11-25-3.3%-2.8%
2019-10-25-2.5%-3.3%
2019-09-25-0.7%-2.5%
2019-08-26-0.8%-0.7%
2019-07-251.1%-0.8%
2019-06-252.4%1.1%
2019-05-242.4%2.4%
2019-04-251.7%2.4%
2019-03-251.8%1.7%
2019-02-251.7%1.8%
2019-01-252.9%1.7%
2018-12-264.5%2.9%
2018-11-235.3%4.5%
2018-10-255.1%5.3%
2018-09-254.6%5.1%
2018-08-244.1%4.6%
2018-07-253.0%4.1%
2018-06-251.9%3.0%
2018-05-251.3%1.9%
2018-04-251.3%1.3%
2018-03-230.0%1.3%
2018-02-231.8%0.0%
2018-01-243.1%1.8%
2017-12-222.8%3.1%
2017-11-243.5%2.8%
2017-10-253.3%3.5%
2017-09-253.0%3.3%
2017-08-253.2%3.0%
2017-07-255.3%3.2%
2017-06-266.0%5.3%
2017-05-246.0%6.0%
2017-04-257.4%6.0%
2017-03-247.5%7.4%
2017-02-242.9%7.5%
2017-01-250.6%2.9%
2016-12-230.3%0.6%
2016-11-25-2.0%0.3%
2016-10-25-3.1%-2.0%
2016-09-23-4.6%-3.1%
2016-08-25-4.7%-4.6%
2016-07-26-5.6%-4.7%
2016-06-24-6.1%-5.6%
2016-05-25-5.4%-6.1%
2016-04-25-5.7%-5.4%
2016-03-23-4.2%-5.7%
2016-02-25-1.7%-4.2%
2016-01-25-2.6%-1.7%
2015-12-23-3.6%-2.6%
2015-11-25-3.6%-3.6%
2015-10-26-2.2%-3.6%
2015-09-25-1.3%-2.2%
2015-08-25-1.3%-1.3%-1.3%
2015-07-24-1.4%-1.3%-1.6%
2015-06-25-0.9%-1.4%-1.0%
2015-05-25-1.3%-0.9%-1.1%
2015-04-24-1.6%-1.3%
2015-03-25-2.8%-1.6%-1.8%
2015-02-25-3.7%-2.8%
2015-01-26-1.5%-3.7%-1.2%
2014-12-23-1.2%-1.5%-0.4%
2014-11-25-0.3%-1.2%-0.1%
2014-10-24-0.6%-0.3%0.0%
2014-09-25-0.5%-0.6%-0.1%
2014-08-250.4%-0.5%0.1%
2014-07-25-0.4%0.4%
2014-06-25-0.2%-0.4%-0.6%
2014-05-26-1.3%-0.2%0.5%
2014-04-25-2.9%-1.3%-1.4%
2014-03-25-1.9%-2.9%-1.9%
2014-02-250.6%-1.9%-0.7%
2014-01-24-0.5%0.6%-0.5%
2013-12-23-0.2%-0.5%-0.1%
2013-11-250.1%-0.2%0.1%
2013-10-25-0.1%0.1%-0.2%
2013-09-250.8%-0.1%0.5%
2013-08-261.3%0.8%1.5%
2013-07-240.6%1.3%1.5%
2013-06-25-0.6%0.6%-0.2%
2013-05-240.0%-0.6%0.9%
2013-04-242.2%0.0%1.9%
2013-03-252.6%2.2%2.5%
2013-02-253.3%2.6%2.4%
2013-01-252.8%3.3%2.8%
2012-12-213.4%2.8%3.3%
2012-11-233.8%3.4%4.0%
2012-10-254.1%3.8%4.0%
2012-09-252.6%4.1%2.7%
2012-08-242.5%2.6%2.9%
2012-07-243.2%2.5%3.2%
2012-06-253.0%3.2%2.7%
2012-05-254.5%3.0%3.2%
2012-04-253.4%4.5%3.4%
2012-03-233.7%3.4%3.6%
2012-02-245.2%3.7%4.7%
2012-01-256.3%5.2%6.0%
2011-12-236.5%6.3%6.2%
2011-11-257.1%6.5%7.0%
2011-10-257.1%7.1%7.0%
2011-09-237.5%7.1%
2011-08-256.7%7.5%6.5%
2011-07-226.7%6.7%6.4%
2011-06-247.3%6.7%7.3%
2011-05-257.8%7.3%7.9%
2011-04-257.6%7.8%7.7%
2011-03-256.8%7.6%7.2%
2011-02-255.3%6.8%5.5%
2011-01-254.4%5.3%5.0%
2010-12-234.1%4.4%4.3%
2010-11-253.4%4.1%3.6%
2010-10-252.7%3.4%3.3%
2010-09-243.2%2.7%2.6%
2010-08-253.2%3.2%2.8%
2010-07-2303.2%3.3%
08:30
Exports (MoM) (Oct) 16,1%   17,5%
OpisExports of goods and services consist of transactions in goods and services (sales, barter, gifts or grants) from residents to non-residents. Exports free on board (f.o.b.) and imports cost insurance freight (c.i.f.) are, in general, customs statistics reported under the general trade statistics according to the recommendations of the UN International Trade Statistics. A higher than expected number should be taken as positive to the HKD, while a lower than expected number as negative.
PriorytetNiski
DataPoprzednia wartośćKolejna wartośćPrzewidywana wartość
2025-10-2714.5%16.1%
2025-09-2514.3%14.5%
2025-08-2611.9%14.3%
2025-07-2815.5%11.9%
2025-06-2614.7%15.5%
2025-05-2618.5%14.7%
2025-04-2815.4%18.5%
2025-03-250.1%15.4%
2025-02-255.2%0.1%
2025-01-272.1%5.2%
2024-12-303.5%2.1%
2024-11-264.7%3.5%
2024-10-286.4%4.7%
2024-09-2613.1%6.4%
2024-08-2710.7%13.1%
2024-07-2514.8%10.7%
2024-06-2511.9%14.8%
2024-05-274.7%11.9%
2024-04-25-0.8%4.7%
2024-03-2633.6%-0.8%
2024-02-2711.0%33.6%
2024-01-257.4%11.0%
2023-12-281.4%7.4%
2023-11-27-5.3%1.4%
2023-10-26-3.7%-5.3%
2023-09-26-9.1%-3.7%
2023-08-24-11.4%-9.1%-13.6%
2023-07-25-15.6%-11.4%-24.2%
2023-06-27-13.0%-15.6%-17.3%
2023-05-29-1.5%-13.0%-21.6%
2023-04-25-8.8%-1.5%-24.5%
2023-03-27-36.7%-8.8%
2023-02-27-28.9%-36.7%
2023-01-26-24.1%-28.9%
2022-12-29-10.4%-24.1%
2022-11-28-9.1%-10.4%
2022-10-25-14.3%-9.1%
2022-09-26-8.9%-14.3%
2022-08-25-6.4%-8.9%
2022-07-25-1.4%-6.4%
2022-06-271.1%-1.4%
2022-05-26-8.9%1.1%
2022-04-280.9%-8.9%
2022-03-2818.4%0.9%
2022-02-2424.8%18.4%
2022-01-2725.0%24.8%
2021-12-2821.4%25.0%
2021-11-2516.5%21.4%
2021-10-2625.9%16.5%
2021-09-2826.9%25.9%
2021-08-2633.0%26.9%
2021-07-2624.0%33.0%
2021-06-2824.4%24.0%
2021-05-2726.4%24.4%
2021-04-2730.4%26.4%
2021-03-2544.0%30.4%
2021-02-2511.7%44.0%
2021-01-265.6%11.7%
2020-12-28-1.1%5.6%
2020-11-249.1%-1.1%
2020-10-27-2.3%9.1%
2020-09-24-3.0%-2.3%
2020-08-26-1.3%-3.0%
2020-07-27-7.4%-1.3%
2020-06-29-3.7%-7.4%
2020-05-25-5.8%-3.7%
2020-04-274.3%-5.8%
2020-03-26-22.7%4.3%
2020-02-253.3%-22.7%
2020-01-30-1.4%3.3%
2019-12-30-9.2%-1.4%
2019-11-26-7.3%-9.2%
2019-10-24-6.3%-7.3%
2019-09-26-5.7%-6.3%
2019-08-26-9.0%-5.7%
2019-07-25-2.4%-9.0%
2019-06-25-2.6%-2.4%
2019-05-27-1.2%-2.6%
2019-04-29-6.9%-1.2%
2019-03-26-0.4%-6.9%
2019-02-26-5.8%-0.4%
2019-01-28-0.8%-5.8%
2018-12-2714.6%-0.8%
2018-11-264.5%14.6%
2018-10-2513.1%4.5%
2018-09-2710.0%13.1%
2018-08-273.3%10.0%
2018-07-2615.9%3.3%
2018-06-268.1%15.9%
2018-05-288.0%8.1%
2018-04-261.7%8.0%
2018-03-2718.1%1.7%
2018-02-276.0%18.1%
2018-01-257.8%6.0%
2017-12-286.7%7.8%
2017-11-279.4%6.7%
2017-10-267.4%9.4%
2017-09-267.3%7.4%
2017-08-2411.1%7.3%
2017-07-274.0%11.1%
2017-06-267.1%4.0%
2017-05-2516.9%7.1%
2017-04-2518.2%16.9%
2017-03-27-1.2%18.2%
2017-02-2710.1%-1.2%
2017-01-268.1%10.1%
2016-12-29-1.8%8.1%
2016-11-243.6%-1.8%
2016-10-270.8%3.6%
2016-09-27-5.1%0.8%
2016-08-25-1.0%-5.1%
2016-07-26-0.1%-1.0%
2016-06-27-2.3%-0.1%
2016-05-26-7.0%-2.3%-7.8%
2016-04-26-10.4%-7.0%-7.0%
2016-03-29-3.8%-10.4%-4.5%
2016-02-25-1.1%-3.8%-3.5%
2016-01-26-3.5%-1.1%-2.7%
2015-12-28-3.7%-3.5%-2.6%
2015-11-26-4.6%-3.7%-3.8%
2015-10-27-6.1%-4.6%-4.0%
2015-09-24-1.6%-6.1%-2.1%
2015-08-25-3.1%-1.6%-2.5%
2015-07-27-4.6%-3.1%-2.6%
2015-06-252.2%-4.6%0.9%
2015-05-28-1.8%2.2%1.0%
2015-04-287.2%-1.8%2.5%
2015-03-262.8%7.2%4.8%
2015-02-260.6%2.8%2.2%
2015-01-270.4%0.6%2.5%
2014-12-292.7%0.4%
2014-11-254.5%2.7%4.0%
2014-10-276.4%4.5%5.4%
2014-09-256.8%6.4%7.4%
2014-08-2511.4%6.8%5.3%
2014-07-244.9%11.4%6.9%
2014-06-26-1.60%4.9%2.00%
2014-05-273.40%-1.60%4.60%
2014-04-28-1.30%3.40%-1.10%
2014-03-01-0.50%-1.30%
2014-02-010.00%-0.50%
2014-01-015.70%0.00%
2013-12-018.80%5.70%
2013-11-011.40%8.80%
2013-10-01-1.30%1.40%
2013-09-0110.60%-1.30%
2013-08-01-0.20%10.60%
2013-07-01-1.00%-0.20%
2013-06-019.00%-1.00%
2013-05-0111.10%9.00%
2013-04-01-17.00%11.10%
2013-03-0117.60%-17.00%
2013-02-0114.40%17.60%
2013-01-0110.50%14.40%
2012-12-01-2.80%10.50%
2012-11-0115.30%-2.80%
2012-10-010.60%15.30%
2012-09-01-3.50%0.60%
2012-08-01-4.80%-3.50%
2012-07-015.20%-4.80%
2012-06-015.60%5.20%
2012-05-01-6.70%5.60%
2012-04-0114.10%-6.70%
2012-03-01-8.60%14.10%
2012-02-017.40%-8.60%
2012-01-012.10%7.40%
2011-12-0111.50%2.10%
2011-11-01-3.10%11.50%
2011-10-016.90%-3.10%
2011-09-019.30%6.90%
2011-08-019.20%9.30%
2011-07-0110.20%9.20%
2011-06-014.00%10.20%
2011-05-0121.50%4.00%
2011-04-0124.90%21.50%
2011-03-0127.60%24.90%
2011-02-0112.50%27.60%
2011-01-0116.60%12.50%
2010-12-0113.80%16.60%
2010-11-0124.00%13.80%
2010-10-0136.00%24.00%
2010-09-0123.30%36.00%
2010-08-0126.70%23.30%
2010-07-0124.40%26.70%
2010-06-0121.80%24.40%
2010-05-0131.90%21.80%
2010-04-0128.70%31.90%
2010-03-0118.30%28.70%
2010-02-019.20%18.30%
2010-01-011.30%9.20%
2009-12-01-13.00%1.30%
2009-11-01-8.50%-13.00%
2009-10-01-14.00%-8.50%
2009-09-01-19.90%-14.00%
2009-08-01-5.40%-19.90%
2009-07-01-14.40%-5.40%
2009-06-01-18.30%-14.40%
2009-05-01-21.10%-18.30%
2009-04-01-23.20%-21.10%
2009-03-01-21.80%-23.20%
2009-02-01-11.40%-21.80%
2009-01-01-5.30%-11.40%
2008-12-019.40%-5.30%
2008-11-013.50%9.40%
2008-10-012.00%3.50%
2008-09-0111.20%2.00%
2008-08-01-0.50%11.20%
2008-07-0110.30%-0.50%
2008-06-0114.50%10.30%
2008-05-017.60%14.50%
2008-04-017.60%7.60%
2008-03-0115.70%7.60%
2008-02-018.10%15.70%
2008-01-016.60%8.10%
2007-12-019.80%6.60%
2007-11-018.50%9.80%
2007-10-017.50%8.50%
2007-09-018.60%7.50%
2007-08-0111.00%8.60%
2007-07-0112.10%11.00%
2007-06-0112.70%12.10%
2007-05-016.90%12.70%
2007-04-0111.60%6.90%
2007-03-019.00%11.60%
2007-02-0113.80%9.00%
2007-01-0114.40%13.80%
2006-12-017.90%14.40%
2006-11-014.80%7.90%
2006-10-019.90%4.80%
2006-09-0110.60%9.90%
2006-08-016.70%10.60%
2006-07-01-0.20%6.70%
2006-06-019.50%-0.20%
2006-05-0114.60%9.50%
2006-04-0120.50%14.60%
2006-03-014.20%20.50%
2006-02-016.70%4.20%
2006-01-0111.40%6.70%
2005-12-0111.60%11.40%
2005-11-0116.80%11.60%
2005-10-0112.70%16.80%
2005-09-018.10%12.70%
2005-08-0112.70%8.10%
2005-07-0116.80%12.70%
2005-06-017.80%16.80%
2005-05-013.60%7.80%
2005-04-01-5.30%3.60%
2005-03-0134.90%-5.30%
2005-02-0112.90%34.90%
2005-01-0117.00%12.90%
2004-12-0116.20%17.00%
2004-11-0114.10%16.20%
2004-10-0120.80%14.10%
2004-09-0116.60%20.80%
2004-08-0118.10%16.60%
2004-07-0115.80%18.10%
2004-06-0119.20%15.80%
2004-05-0113.90%19.20%
2004-04-0128.20%13.90%
2004-03-010.20%28.20%
2004-02-0115.80%0.20%
2004-01-019.10%15.80%
2003-12-019.50%9.10%
2003-11-016.40%9.50%
2003-10-017.10%6.40%
2003-09-017.50%7.10%
2003-08-0114.00%7.50%
2003-07-0113.70%14.00%
2003-06-018.90%13.70%
2003-05-0115.30%8.90%
2003-04-0110.30%15.30%
2003-03-0126.70%10.30%
2003-02-0116.60%26.70%
2003-01-0117.30%16.60%
2002-12-0112.70%17.30%
2002-11-019.90%12.70%
2002-10-015.80%9.90%
2002-09-019.80%5.80%
2002-08-017.90%9.80%
2002-07-01-1.90%7.90%
2002-06-012.50%-1.90%
2002-05-012.20%2.50%
2002-04-01-9.10%2.20%
2002-03-01-12.20%-9.10%
2002-02-01-10.30%-12.20%
2002-01-01-11.40%-10.30%
2001-12-01-13.80%-11.40%
2001-11-01-11.00%-13.80%
2001-10-01-9.10%-11.00%
2001-09-01-0.70%-9.10%
2001-08-01-8.20%-0.70%
2001-07-01-3.60%-8.20%
2001-06-01-2.40%-3.60%
2001-05-01-1.20%-2.40%
2001-04-0110.00%-1.20%
2001-03-01-0.50%10.00%
2001-02-014.60%-0.50%
2001-01-018.80%4.60%
2000-12-0123.40%8.80%
2000-11-0125.00%23.40%
08:30
Imports (MoM) (Oct) 13,6%   18,3%
OpisExports free on board (f.o.b.) and Imports cost insurance freight (c.i.f.) are, in general, customs statistics reported under the general trade statistics according to the recommendations of the UN International Trade Statistics. For some countries Imports are reported as f.o.b. instead of c.i.f. which is generally accepted. When reporting Imports as f.o.b. you will have the effect of reducing the value of Imports by the amount of the cost of insurance and freight. A higher than expected number should be taken as positive to the HKD, while a lower than expected number as negative.
PriorytetNiski
DataPoprzednia wartośćKolejna wartośćPrzewidywana wartość
2025-10-2711.5%13.6%
2025-09-2516.5%11.5%
2025-08-2611.1%16.5%
2025-07-2818.9%11.1%
2025-06-2615.8%18.9%
2025-05-2616.6%15.8%
2025-04-2811.8%16.6%
2025-03-250.5%11.8%
2025-02-25-1.1%0.5%
2025-01-275.7%-1.1%
2024-12-304.5%5.7%
2024-11-261.4%4.5%
2024-10-287.9%1.4%
2024-09-269.9%7.9%
2024-08-279.0%9.9%
2024-07-259.6%9.0%
2024-06-253.7%9.6%
2024-05-275.3%3.7%
2024-04-25-1.8%5.3%
2024-03-2621.7%-1.8%
2024-02-2711.6%21.7%
2024-01-257.1%11.6%
2023-12-282.6%7.1%
2023-11-27-0.4%2.6%
2023-10-26-0.3%-0.4%
2023-09-26-7.9%-0.3%
2023-08-24-12.3%-7.9%-8.2%
2023-07-25-16.7%-12.3%-11.1%
2023-06-27-11.9%-16.7%-13.5%
2023-05-29-0.6%-11.9%-16.5%
2023-04-25-4.1%-0.6%-18.5%
2023-03-27-30.2%-4.1%
2023-02-27-23.5%-30.2%
2023-01-26-20.3%-23.5%
2022-12-29-11.9%-20.3%
2022-11-28-7.8%-11.9%
2022-10-25-16.3%-7.8%
2022-09-26-9.9%-16.3%
2022-08-250.5%-9.9%
2022-07-251.3%0.5%
2022-06-272.1%1.3%
2022-05-26-6.0%2.1%
2022-04-286.2%-6.0%
2022-03-289.6%6.2%
2022-02-2419.3%9.6%
2022-01-2720.0%19.3%
2021-12-2817.7%20.0%
2021-11-2523.5%17.7%
2021-10-2628.1%23.5%
2021-09-2826.1%28.1%
2021-08-2631.9%26.1%
2021-07-2626.5%31.9%
2021-06-2825.2%26.5%
2021-05-2721.7%25.2%
2021-04-2717.6%21.7%
2021-03-2537.7%17.6%
2021-02-2514.1%37.7%
2021-01-265.1%14.1%
2020-12-280.6%5.1%
2020-11-243.4%0.6%
2020-10-27-5.7%3.4%
2020-09-24-3.4%-5.7%
2020-08-26-7.1%-3.4%
2020-07-27-12.3%-7.1%
2020-06-29-6.7%-12.3%
2020-05-25-11.1%-6.7%
2020-04-27-0.1%-11.1%
2020-03-26-16.4%-0.1%
2020-02-25-1.9%-16.4%
2020-01-30-5.8%-1.9%
2019-12-30-11.5%-5.8%
2019-11-26-10.3%-11.5%
2019-10-24-11.1%-10.3%
2019-09-26-8.7%-11.1%
2019-08-26-7.5%-8.7%
2019-07-25-4.3%-7.5%
2019-06-25-5.5%-4.3%
2019-05-27-0.1%-5.5%
2019-04-29-3.8%-0.1%
2019-03-26-6.0%-3.8%
2019-02-26-7.0%-6.0%
2019-01-280.5%-7.0%
2018-12-2713.1%0.5%
2018-11-264.8%13.1%
2018-10-2516.4%4.8%
2018-09-2714.0%16.4%
2018-08-274.4%14.0%
2018-07-2616.5%4.4%
2018-06-2611.1%16.5%
2018-05-2810.7%11.1%
2018-04-26-3.2%10.7%
2018-03-2723.8%-3.2%
2018-02-279.0%23.8%
2018-01-258.6%9.0%
2017-12-287.9%8.6%
2017-11-279.7%7.9%
2017-10-267.7%9.7%
2017-09-265.5%7.7%
2017-08-2410.4%5.5%
2017-07-276.6%10.4%
2017-06-267.3%6.6%
2017-05-2513.0%7.3%
2017-04-2525.4%13.0%
2017-03-27-2.7%25.4%
2017-02-278.7%-2.7%
2017-01-267.6%8.7%
2016-12-290.5%7.6%
2016-11-244.1%0.5%
2016-10-272.8%4.1%
2016-09-27-3.3%2.8%
2016-08-25-0.9%-3.3%
2016-07-26-4.3%-0.9%
2016-06-27-4.5%-4.3%
2016-05-26-5.8%-4.5%-6.0%
2016-04-26-10.1%-5.8%-7.5%
2016-03-29-9.0%-10.1%-8.0%
2016-02-25-4.6%-9.0%-5.8%
2016-01-26-8.1%-4.6%-7.2%
2015-12-28-8.5%-8.1%-7.1%
2015-11-26-7.6%-8.5%-7.1%
2015-10-27-7.4%-7.6%-8.0%
2015-09-24-5.2%-7.4%-4.2%
2015-08-25-2.0%-5.2%-2.7%
2015-07-27-4.7%-2.0%-3.4%
2015-06-25-2.9%-4.7%-1.6%
2015-05-28-2.7%-2.9%0.5%
2015-04-28-0.9%-2.7%-0.8%
2015-03-267.9%-0.9%6.0%
2015-02-261.9%7.9%4.0%
2015-01-272.4%1.9%2.7%
2014-12-295.6%2.4%
2014-11-256.3%5.6%4.3%
2014-10-273.4%6.3%1.4%
2014-09-257.5%3.4%6.7%
2014-08-257.6%7.5%5.7%
2014-07-243.70%7.6%5.30%
2014-06-262.40%3.70%2.50%
2014-05-273.20%2.40%4.50%
2014-04-286.80%3.20%-2.40%
2014-03-01-2.70%6.80%
2014-02-011.80%-2.70%
2014-01-015.20%1.80%
2013-12-016.30%5.20%
2013-11-010.40%6.30%
2013-10-01-0.20%0.40%
2013-09-018.30%-0.20%
2013-08-011.40%8.30%
2013-07-011.70%1.40%
2013-06-017.70%1.70%
2013-05-0111.30%7.70%
2013-04-01-18.30%11.30%
2013-03-0123.90%-18.30%
2013-02-0111.90%23.90%
2013-01-019.00%11.90%
2012-12-013.30%9.00%
2012-11-0114.90%3.30%
2012-10-010.90%14.90%
2012-09-01-1.80%0.90%
2012-08-01-2.90%-1.80%
2012-07-014.60%-2.90%
2012-06-015.00%4.60%
2012-05-01-4.70%5.00%
2012-04-0120.80%-4.70%
2012-03-01-10.50%20.80%
2012-02-018.10%-10.50%
2012-01-018.80%8.10%
2011-12-0110.90%8.80%
2011-11-012.30%10.90%
2011-10-0114.10%2.30%
2011-09-0110.20%14.10%
2011-08-0111.50%10.20%
2011-07-0113.00%11.50%
2011-06-016.10%13.00%
2011-05-0118.80%6.10%
2011-04-0125.20%18.80%
2011-03-0119.00%25.20%
2011-02-0114.80%19.00%
2011-01-0116.40%14.80%
2010-12-0114.00%16.40%
2010-11-0119.50%14.00%
2010-10-0128.40%19.50%
2010-09-0124.90%28.40%
2010-08-0131.00%24.90%
2010-07-0129.70%31.00%
2010-06-0128.80%29.70%
2010-05-0139.80%28.80%
2010-04-0122.40%39.80%
2010-03-0139.50%22.40%
2010-02-0118.70%39.50%
2010-01-016.50%18.70%
2009-12-01-10.70%6.50%
2009-11-01-3.10%-10.70%
2009-10-01-9.80%-3.10%
2009-09-01-17.80%-9.80%
2009-08-01-7.90%-17.80%
2009-07-01-19.20%-7.90%
2009-06-01-17.00%-19.20%
2009-05-01-22.70%-17.00%
2009-04-01-17.50%-22.70%
2009-03-01-27.10%-17.50%
2009-02-01-16.20%-27.10%
2009-01-01-7.90%-16.20%
2008-12-0111.30%-7.90%
2008-11-013.90%11.30%
2008-10-011.50%3.90%
2008-09-0115.40%1.50%
2008-08-011.30%15.40%
2008-07-0115.40%1.30%
2008-06-0111.30%15.40%
2008-05-016.60%11.30%
2008-04-0111.90%6.60%
2008-03-0116.90%11.90%
2008-02-0110.30%16.90%
2008-01-019.30%10.30%
2007-12-0112.10%9.30%
2007-11-019.30%12.10%
2007-10-019.00%9.30%
2007-09-019.80%9.00%
2007-08-0113.00%9.80%
2007-07-0111.10%13.00%
2007-06-0114.70%11.10%
2007-05-0111.10%14.70%
2007-04-011.30%11.10%
2007-03-0114.10%1.30%
2007-02-0114.50%14.10%
2007-01-0116.30%14.50%
2006-12-0111.20%16.30%
2006-11-018.20%11.20%
2006-10-0112.30%8.20%
2006-09-0111.40%12.30%
2006-08-019.90%11.40%
2006-07-012.50%9.90%
2006-06-0111.20%2.50%
2006-05-0116.00%11.20%
2006-04-0128.30%16.00%
2006-03-010.60%28.30%
2006-02-0110.60%0.60%
2006-01-0113.60%10.60%
2005-12-019.70%13.60%
2005-11-0115.10%9.70%
2005-10-0112.90%15.10%
2005-09-016.50%12.90%
2005-08-0110.50%6.50%
2005-07-0116.00%10.50%
2005-06-013.80%16.00%
2005-05-012.50%3.80%
2005-04-01-10.90%2.50%
2005-03-0137.20%-10.90%
2005-02-0110.50%37.20%
2005-01-0111.20%10.50%
2004-12-0113.30%11.20%
2004-11-0114.80%13.30%
2004-10-0121.60%14.80%
2004-09-0118.40%21.60%
2004-08-0121.50%18.40%
2004-07-0119.90%21.50%
2004-06-0124.60%19.90%
2004-05-0115.40%24.60%
2004-04-0133.30%15.40%
2004-03-010.90%33.30%
2004-02-0117.90%0.90%
2004-01-0113.80%17.90%
2003-12-0110.20%13.80%
2003-11-017.30%10.20%
2003-10-016.00%7.30%
2003-09-015.60%6.00%
2003-08-0111.50%5.60%
2003-07-019.40%11.50%
2003-06-018.40%9.40%
2003-05-0114.60%8.40%
2003-04-0118.30%14.60%
2003-03-0121.40%18.30%
2003-02-0116.20%21.40%
2003-01-0115.20%16.20%
2002-12-0113.40%15.20%
2002-11-016.20%13.40%
2002-10-015.80%6.20%
2002-09-017.30%5.80%
2002-08-016.00%7.30%
2002-07-01-2.10%6.00%
2002-06-01-2.10%-2.10%
2002-05-010.20%-2.10%
2002-04-01-19.80%0.20%
2002-03-01-8.60%-19.80%
2002-02-01-13.50%-8.60%
2002-01-01-11.50%-13.50%
2001-12-01-14.90%-11.50%
2001-11-01-9.00%-14.90%
2001-10-01-9.30%-9.00%
2001-09-01-0.90%-9.30%
2001-08-01-6.60%-0.90%
2001-07-01-3.20%-6.60%
2001-06-01-0.40%-3.20%
2001-05-01-1.50%-0.40%
2001-04-0119.90%-1.50%
2001-03-01-4.00%19.90%
2001-02-016.20%-4.00%
2001-01-0111.60%6.20%
2000-12-0125.30%11.60%
2000-11-0125.40%25.30%
08:30
Trade Balance (Oct) -50,2B   -39,9B
OpisThe Trade Balance measures the difference in value between imported and exported goods and services over the reported period. A positive number indicates that more goods and services were exported than imported.A higher than expected reading should be taken as positive/bullish for the HKD, while a lower than expected reading should be taken as negative/bearish for the HKD.
PriorytetNiski
DataPoprzednia wartośćKolejna wartośćPrzewidywana wartość
2025-10-27-25.4B-50.2B
2025-09-25-34.1B-25.4B
2025-08-26-58.9B-34.1B
2025-07-28-27.3B-58.9B
2025-06-26-16.0B-27.3B
2025-05-26-45.4B-16.0B
2025-04-28-36.3B-45.4B
2025-03-252.1B-36.3B
2025-02-25-34.5B2.1B
2025-01-27-43.4B-34.5B
2024-12-30-31.0B-43.4B
2024-11-26-53.2B-31.0B
2024-10-28-33.1B-53.2B
2024-09-26-21.8B-33.1B
2024-08-27-55.7B-21.8B
2024-07-25-12.1B-55.7B
2024-06-25-10.0B-12.1B
2024-05-27-45.0B-10.0B
2024-04-25-41.7B-45.0B
2024-03-263.6B-41.7B
2024-02-27-59.9B3.6B
2024-01-25-27.9B-59.9B
2023-12-28-25.8B-27.9B
2023-11-27-64.6B-25.8B
2023-10-26-25.6B-64.6B
2023-09-26-30.0B-25.6B
2023-08-24-56.6B-30.0B-32.7B
2023-07-25-26.4B-56.6B-42.4B
2023-06-27-36.6B-26.4B-32.6B
2023-05-29-40.6B-36.6B-25.7B
2023-04-25-45.4B-40.6B-21.0B
2023-03-27-25.4B-45.4B
2023-02-27-51.6B-25.4B
2023-01-26-27.1B-51.6B
2022-12-29-20.9B-27.1B
2022-11-28-44.9B-20.9B
2022-10-25-13.3B-44.9B
2022-09-26-27.6B-13.3B
2022-08-25-68.5B-27.6B
2022-07-25-36.7B-68.5B
2022-06-27-36.6B-36.7B
2022-05-26-37.3B-36.6B
2022-04-28-32.1B-37.3B
2022-03-286.6B-32.1B
2022-02-24-32.8B6.6B
2022-01-27-11.6B-32.8B
2021-12-28-30.5B-11.6B
2021-11-25-42.4B-30.5B
2021-10-26-26.3B-42.4B
2021-09-28-34.9B-26.3B
2021-08-26-40.5B-34.9B
2021-07-26-25.5B-40.5B
2021-06-28-31.8B-25.5B
2021-05-27-27.0B-31.8B
2021-04-27-14.7B-27.0B
2021-03-25-25.2B-14.7B
2021-02-25-45.7B-25.2B
2021-01-26-25.6B-45.7B
2020-12-28-36.8B-25.6B
2020-11-24-12.7B-36.8B
2020-10-27-14.6B-12.7B
2020-09-24-29.8B-14.6B
2020-08-26-33.3B-29.8B
2020-07-27-13.7B-33.3B
2020-06-29-23.3B-13.7B
2020-05-25-34.7B-23.3B
2020-04-27-38.6B-34.7B
2020-03-26-30.6B-38.6B
2020-02-25-32.5B-30.6B
2020-01-30-26.2B-32.5B
2019-12-30-30.6B-26.2B
2019-11-26-31.6B-30.6B
2019-10-24-28.0B-31.6B
2019-09-26-32.2B-28.0B
2019-08-26-55.2B-32.2B
2019-07-25-34.7B-55.2B
2019-06-25-35.1B-34.7B
2019-05-27-59.3B-35.1B
2019-04-29-48.8B-59.3B
2019-03-26-10.3B-48.8B
2019-02-26-51.2B-10.3B
2019-01-28-45.0B-51.2B
2018-12-27-44.5B-45.0B
2018-11-26-47.7B-44.5B
2018-10-25-52.1B-47.7B
2018-09-27-47.1B-52.1B
2018-08-27-54.1B-47.1B
2018-07-26-43.3B-54.1B
2018-06-26-46.9B-43.3B-47.0B
2018-05-28-55.5B-46.9B
2018-04-26-42.7B-55.5B
2018-03-27-31.9B-42.7B
2018-02-27-59.9B-31.9B
2018-01-25-44.0B-59.9B
2017-11-27-44.7B-44.0B-44.7B
2017-10-26-35.5B-44.7B-38.5B
2017-09-26-29.6B-35.5B
2017-08-24-48.3B-29.6B
2017-07-27-35.7B-48.3B
2017-06-26-34.1B-35.7B
2017-05-25-42.3B-34.1B
2017-04-25-56.3B-42.3B
2017-03-27-12.3B-56.3B
2017-02-27-45.5B-12.3B
2017-01-26-34.1B-45.5B
2016-12-29-37.2B-34.1B
2016-11-24-39.7B-37.2B
2016-10-27-32.1B-39.7B
2016-09-27-33.3B-32.1B
2016-08-25-45.6B-33.3B
2016-07-26-26.2B-45.6B
2016-06-27-31.0B-26.2B
2016-05-26-47.0B-31.0B-38.6B
2016-04-26-33.2B-47.0B-35.0B
2016-03-29-17.5B-33.2B-30.7B
2016-02-25-45.7B-17.5B-29.9B
2016-01-26-33.1B-45.7B-39.6B
2015-12-28-29.7B-33.1B-36.9B
2015-11-26-36.4B-29.7B-35.2B
2015-10-27-25.1B-36.4B-33.1B
2015-09-24-28.4B-25.1B-23.3B
2015-08-25-45.8B-28.4B-41.2B
2015-07-27-40.1B-45.8B-39.1B
2015-06-25-39.2B-40.1B-32.2B
2015-05-28-46.2B-39.2B-45.0B
2015-04-28-35.9B-46.2B-37.5B
2015-03-26-37.0B-35.9B-54.6B
2015-02-26-59.3B-37.0B-31.8B
2015-01-27-52.2B-59.3B-54.5B
2014-12-29-49.8B-52.2B50.0B
2014-11-25-50.4B-49.8B-45.3B
2014-10-27-31.5B-50.4B-30.0B
2014-09-25-42.1B-31.5B-43.3B
2014-08-25-43.1B-42.1B-40.4B
2014-07-24-42.4B-43.1B-48.5B
2014-06-26-55.3B-42.4B-49.8B
2014-05-27-50.4B-55.3B-46.5B
2014-04-28-53.7B-50.4B-42.9B
2014-03-25-20.0B-53.7B-39.0B
2014-02-25-54.4B-20.0B-37.0B
2014-01-27-44.6B-54.4B-46.0B
2013-12-30-38.5B-44.6B-42.3B
2013-11-26-42.0B-38.5B-40.0B
2013-10-24-39.6B-42.0B-40.0B
2013-09-26-37.2B-39.6B-33.0B
2013-08-27-49.7B-37.2B-45.0B
2013-07-25-44.3B-49.7B-48.2B
2013-06-25-42.7B-44.3B-38.8B
2013-05-27-49.2B-42.7B-46.4B
2013-04-25-34.0B-49.2B-47.0B
2013-03-26-27.5B-34.0B-39.0B
2013-02-25-48.0B-27.5B-29.0B
2013-01-24-44.1B-48.0B-50.3B
2012-12-27-42.7B-44.1B-44.8B
2012-11-27-45.2B-42.7B-35.2B
2012-10-25-36.0B-45.2B-40.8B
2012-09-25-40.1B-36.0B-39.0B
2012-08-28-44.7B-40.1B-48.6B
2012-07-24-35.6B-44.7B-40.2B
2012-06-26-42.9B-35.6B-35.0B
2012-05-24-43.9B-42.9B-41.5B
2012-04-24-45.8B-43.9B-25.0B
2012-03-27-8.9B-45.8B-15.0B
2012-02-23-48.9B-8.9B-25.0B
2012-01-26-44.1B-48.9B-40.0B
2011-12-29-23.1B-44.1B-25.0B
2011-11-24-40.0B-23.1B-38.0B
2011-10-25-34.8B-40.0B-38.0B
2011-09-27-35.9B-34.8B-24.0B
2011-08-25-40.3B-35.9B-38.0B
2011-07-28-35.7B-40.3B-38.0B
2011-06-28-42.4B-35.7B-35.0B
2011-05-26-40.1B-42.4B-32.0B
2011-04-28-25.1B-40.1B-20.0B
2011-03-24-16.0B-25.1B-30.0B
2011-02-24-43.5B-16.0B-15.0B
2011-01-25-23.5B-43.5B-35.0B
2010-12-28-22.3B-23.5B-25.0B
2010-11-25-24.4B-22.3B-19.0B
2010-10-26-11.9B-24.4B-25.0B
2010-09-27-30.5B-11.9B-28.0B
2010-08-26-30.6B-30.5B-27.5B
2010-07-270-30.6B-25.0B
09:00
Retail Sales (YoY) (Oct) 6,6% 3,7% 5,5%
OpisRetail sales data represents total consumer purchase from retail stores. It provides valuable information about consumer spending which makes up the consumption part of GDP. The most volatile components like autos, gas prices and food prices are often removed from the report to show more underlying demand patterns as changes in sales in these categories are frequently a result of price changes. It is not adjusted for inflation. Spending on services is not included. Rising retail sales indicate stronger economic growth. However, if the increase is larger than forecast, it may be inflationary.A higher than expected reading should be taken as positive/bullish for the PLN , while a lower than expected reading should be taken as negative/bearish for the PLN.
PriorytetNiski
DataPoprzednia wartośćKolejna wartośćPrzewidywana wartość
2025-10-223.0%6.6%6.8%
2025-09-224.8%3.0%3.3%
2025-08-252.1%4.8%3.5%
2025-07-224.3%2.1%4.0%
2025-06-247.9%4.3%4.4%
2025-05-260.6%7.9%
2025-04-230.6%0.6%0.3%
2025-03-246.1%0.6%5.0%
2025-02-242.7%6.1%1.5%
2025-01-233.4%2.7%3.8%
2024-12-202.3%3.4%1.0%
2024-11-26-2.2%2.3%0.8%
2024-10-223.2%-2.2%2.1%
2024-09-235.0%3.2%3.4%
2024-08-224.7%5.0%5.6%
2024-07-225.4%4.7%5.3%
2024-06-244.3%5.4%5.7%
2024-05-236.0%4.3%5.1%
2024-04-236.7%6.0%6.7%
2024-03-214.6%6.7%4.9%
2024-02-220.5%4.6%
2024-01-222.6%0.5%
2023-12-214.8%2.6%1.5%
2023-11-223.6%4.8%
2023-10-203.1%3.6%
2023-09-212.1%3.1%
2023-08-222.1%2.1%
2023-07-211.8%2.1%
2023-06-223.4%1.8%
2023-05-234.8%3.4%3.8%
2023-04-2410.8%4.8%7.4%
2023-03-2115.1%10.8%15.0%
2023-02-2115.5%15.1%19.0%
2023-01-2318.4%15.5%17.8%
2022-12-2118.3%18.4%16.9%
2022-12-0518.3%18.3%
2022-11-2321.9%18.3%21.0%
2022-10-2121.5%21.9%21.5%
2022-10-0621.5%21.5%
2022-09-2118.4%21.5%20.0%
2022-08-2219.9%18.4%18.3%
2022-07-2123.6%19.9%21.5%
2022-06-2233.4%23.6%23.3%
2022-05-2322.0%33.4%30.6%
2022-04-2216.5%22.0%19.5%
2022-03-2120.0%16.5%16.7%
2022-03-04-2.0%20.0%
2022-02-2116.9%-2.0%20.2%
2022-01-2421.2%16.9%18.5%
2021-12-2114.4%21.2%16.8%
2021-11-2311.1%14.4%12.4%
2021-10-2110.7%11.1%10.4%
2021-09-218.9%10.7%10.0%
2021-08-2013.0%8.9%9.3%
2021-07-2119.1%13.0%11.2%
2021-06-2225.7%19.1%16.0%
2021-05-2417.1%25.7%27.2%
2021-04-22-2.7%17.1%10.9%
2021-03-19-6.0%-2.7%-2.5%
2021-02-19-0.8%-6.0%-5.0%
2021-02-04-0.8%-0.8%-0.7%
2021-01-22-5.3%-0.8%-0.7%
2020-12-21-2.1%-5.3%-7.4%
2020-11-232.7%-2.1%-0.3%
2020-10-210.4%2.7%2.2%
2020-09-212.7%0.4%2.4%
2020-08-21-1.9%2.7%-0.4%
2020-07-21-8.6%-1.9%-4.0%
2020-06-22-22.6%-8.6%-12.9%
2020-05-22-7.1%-22.6%-16.9%
2020-04-229.6%-7.1%-4.0%
2020-03-205.7%9.6%5.9%
2020-02-217.5%5.7%6.6%
2020-01-235.9%7.5%7.3%
2019-12-205.4%5.9%4.8%
2019-11-255.3%5.4%5.1%
2019-10-216.0%5.3%8.0%
2019-09-207.4%6.0%6.5%
2019-08-225.3%7.4%7.3%
2019-07-197.3%5.3%4.9%
2019-06-2413.6%7.3%8.3%
2019-05-233.1%13.6%8.6%
2019-04-236.5%3.1%3.9%
2019-03-216.6%6.5%6.3%
2019-02-214.7%6.6%6.1%
2019-01-228.2%4.7%7.7%
2018-12-219.7%8.2%7.0%
2018-11-225.6%9.7%8.1%
2018-10-199.0%5.6%7.6%
2018-09-219.3%9.0%9.0%
2018-08-2210.3%9.3%8.4%
2018-07-207.6%10.3%7.9%
2018-06-214.6%7.6%6.6%
2018-05-239.2%4.6%8.1%
2018-04-237.9%9.2%8.2%
2018-03-218.2%7.9%7.3%
2018-02-206.0%8.2%7.3%
2018-01-1910.2%6.0%8.7%
2017-12-198.0%10.2%7.5%
2017-11-208.6%8.0%8.2%
2017-10-187.6%8.6%7.9%
2017-09-197.1%7.6%7.2%
2017-08-186.0%7.1%7.5%
2017-07-198.4%6.0%6.9%
2017-06-208.1%8.4%9.0%
2017-05-199.7%8.1%8.9%
2017-04-207.3%9.7%8.2%
2017-03-1711.4%7.3%8.6%
2017-02-176.4%11.4%7.6%
2017-01-196.6%6.4%6.1%
2016-12-193.7%6.6%4.8%
2016-11-214.8%3.7%4.1%
2016-10-195.6%4.8%6.1%
2016-09-192.0%5.6%4.5%
2016-08-184.6%2.0%4.2%
2016-07-192.2%4.6%3.7%
2016-06-173.2%2.2%3.0%
2016-05-190.8%3.2%3.4%
2016-04-193.9%0.8%3.4%
2016-03-170.9%3.9%3.3%
2016-02-174.9%0.9%2.9%
2016-01-213.3%4.9%3.5%
2015-12-170.8%3.3%2.1%
2015-11-190.1%0.8%0.6%
2015-10-19-0.3%0.1%1.4%
2015-09-171.2%-0.3%1.4%
2015-08-193.8%1.2%2.9%
2015-07-171.8%3.8%3.2%
2015-06-18-1.5%1.8%1.7%
2015-05-203.0%-1.5%1.1%
2015-04-20-1.3%3.0%1.5%
2015-03-180.1%-1.3%-0.1%
2015-02-181.8%0.1%0.6%
2015-01-27-0.2%1.8%1.7%
2014-12-232.3%-0.2%1.9%
2014-11-251.6%2.3%2.2%
2014-10-231.7%1.6%2.5%
2014-09-232.1%1.7%1.3%
2014-08-261.2%2.1%2.1%
2014-07-233.8%1.2%4.1%
2014-06-268.4%3.8%6.8%
2014-05-263.1%8.4%9.1%
2014-04-247.0%3.1%5.7%
2014-03-254.8%7.0%5.9%
2014-02-245.8%4.8%4.6%
2014-01-243.8%5.8%7.0%
2013-12-233.2%3.8%3.1%
2013-11-263.90%3.2%4.10%
2013-10-223.40%3.90%4.40%
2013-09-244.30%3.40%3.10%
2013-08-261.80%4.30%3.10%
2013-07-230.50%1.80%1.15%
2013-06-25-0.20%0.50%0.25%
2013-05-240.10%-0.20%1.00%
2013-04-23-0.80%0.10%0.75%
2013-03-223.10%-0.80%0.40%
2013-02-25-2.50%3.10%0.90%
2013-01-242.40%-2.50%1.40%
2012-12-213.30%2.40%2.95%
2012-11-263.10%3.30%4.00%
2012-10-235.80%3.10%5.05%
2012-09-256.90%5.80%5.90%
2012-08-246.40%6.90%6.90%
2012-07-267.70%6.40%8.95%
2012-06-265.50%7.70%7.30%
2012-05-2510.70%5.50%9.45%
2012-04-2513.70%10.70%10.40%
2012-03-2614.30%13.70%9.90%
2012-02-018.60%14.30%
2012-01-0112.60%8.60%
2011-12-0111.20%12.60%
2011-11-0111.40%11.20%
2011-10-0111.30%11.40%
2011-09-018.20%11.30%
2011-08-0110.90%8.20%
2011-07-0113.80%10.90%
2011-06-0118.60%13.80%
2011-05-019.40%18.60%
2011-04-0112.20%9.40%
2011-03-015.80%12.20%
2011-02-0112.00%5.80%
2011-01-018.30%12.00%
2010-12-019.00%8.30%
2010-11-018.60%9.00%
2010-10-016.60%8.60%
2010-09-013.90%6.60%
2010-08-016.40%3.90%
2010-07-014.30%6.40%
2010-06-01-1.60%4.30%
2010-05-018.70%-1.60%
2010-04-010.10%8.70%
2010-03-012.50%0.10%
2010-02-017.20%2.50%
2010-01-016.30%7.20%
2009-12-012.10%6.30%
2009-11-012.50%2.10%
2009-10-015.20%2.50%
2009-09-015.70%5.20%
2009-08-012.10%5.70%
2009-07-012.40%2.10%
2009-06-012.90%2.40%
2009-05-011.80%2.90%
2009-04-010.60%1.80%
2009-03-013.80%0.60%
2009-02-016.90%3.80%
2009-01-013.00%6.90%
2008-12-019.20%3.00%
2008-11-0112.40%9.20%
2008-10-018.30%12.40%
2008-09-0114.70%8.30%
2008-08-0114.30%14.70%
2008-07-0115.20%14.30%
2008-06-0118.30%15.20%
2008-05-0116.00%18.30%
2008-04-0125.20%16.00%
2008-03-0121.00%25.20%
2008-02-0112.40%21.00%
2008-01-0119.20%12.40%
2007-12-0119.40%19.20%
2007-11-0114.20%19.40%
2007-10-0117.40%14.20%
2007-09-0117.10%17.40%
2007-08-0116.20%17.10%
2007-07-0114.80%16.20%
2007-06-0115.10%14.80%
2007-05-0119.20%15.10%
2007-04-0117.50%19.20%
2007-03-0116.50%17.50%
2007-02-0113.30%16.50%
2007-01-0113.60%13.30%
2006-12-0113.30%13.60%
2006-11-0114.50%13.30%
2006-10-0111.50%14.50%
2006-09-0111.00%11.50%
2006-08-0110.70%11.00%
2006-07-0113.70%10.70%
2006-06-0113.20%13.70%
2006-05-0110.10%13.20%
2006-04-0110.20%10.10%
2006-03-018.60%10.20%
2006-02-016.30%8.60%
2006-01-017.30%6.30%
2005-12-017.50%7.30%
2005-11-015.40%7.50%
2005-10-017.90%5.40%
2005-09-015.00%7.90%
2005-08-0110.50%5.00%
2005-07-018.00%10.50%
2005-06-01-14.40%8.00%
2005-05-01-0.30%-14.40%
2005-04-012.40%-0.30%
2005-03-017.50%2.40%
2005-02-012.80%7.50%
2005-01-014.40%2.80%
2004-12-014.00%4.40%
2004-11-018.80%4.00%
2004-10-019.60%8.80%
2004-09-0110.90%9.60%
2004-08-018.60%10.90%
2004-07-014.00%8.60%
2004-06-0130.60%4.00%
2004-05-0120.70%30.60%
2004-04-0112.10%20.70%
2004-03-017.60%12.10%
2004-02-0117.30%7.60%
2004-01-0111.40%17.30%
2003-12-0110.30%11.40%
2003-11-019.70%10.30%
2003-10-015.50%9.70%
2003-09-015.40%5.50%
2003-08-018.10%5.40%
2003-07-019.70%8.10%
2003-06-0111.00%9.70%
2003-05-01-1.70%11.00%
2003-04-014.20%-1.70%
2003-03-014.10%4.20%
2003-02-014.90%4.10%
2003-01-015.90%4.90%
2002-12-015.10%5.90%
2002-11-014.70%5.10%
2002-10-015.10%4.70%
2002-09-018.60%5.10%
2002-08-012.50%8.60%
2002-07-011.80%2.50%
2002-06-013.10%1.80%
2002-05-019.90%3.10%
2002-04-016.70%9.90%
2002-03-014.70%6.70%
2002-02-012.40%4.70%
2002-01-012.40%2.40%
2001-12-015.80%2.40%
2001-11-011.30%5.80%
2001-10-013.00%1.30%
2001-09-011.50%3.00%
2001-08-010.20%1.50%
2001-07-014.30%0.20%
2001-06-011.90%4.30%
2001-05-010.10%1.90%
2001-04-01-0.20%0.10%
2001-03-0110.90%-0.20%
10:30
German 5-Year Bobl Auction 2,210%   2,270%
OpisThe figures displayed in the calendar represent the average yield on the Bobls note auctioned. German Bobls notes have maturities of five years. Governments issue treasuries to borrow money to cover the gap between the amount they receive in taxes and the amount they spend to refinance existing debt and/or to raise capital. The yield on the Bobls represents the return an investor will receive by holding the treasury for its entire duration. All bidders receive the same rate at the highest accepted bid. Yield fluctuations should be monitored closely as an indicator of the government debt situation. Investors compare the average rate at auction to the rate at previous auctions of the same security.
PriorytetNiski
DataPoprzednia wartośćKolejna wartośćPrzewidywana wartość
2025-10-282.310%2.210%
2025-10-072.290%2.310%
2025-09-162.320%2.290%
2025-08-192.280%2.320%
2025-07-292.260%2.280%
2025-07-082.400%2.260%
2025-06-102.070%2.400%
2025-05-062.060%2.070%
2025-04-152.440%2.060%
2025-03-252.150%2.440%
2025-03-042.170%2.150%
2025-02-112.420%2.170%
2025-01-142.040%2.420%
2024-11-262.130%2.040%
2024-10-291.900%2.130%
2024-10-012.170%1.900%
2024-08-272.090%2.170%
2024-08-062.390%2.090%
2024-07-162.450%2.390%
2024-06-182.560%2.450%
2024-05-212.410%2.560%
2024-04-092.400%2.410%
2024-03-052.300%2.400%
2024-02-132.120%2.300%
2024-01-162.560%2.120%
2023-11-212.710%2.560%
2023-10-242.760%2.710%
2023-09-262.560%2.760%
2023-08-292.500%2.560%
2023-08-082.710%2.500%
2023-07-112.410%2.710%
2023-06-132.270%2.410%
2023-05-092.260%2.270%
2023-04-112.430%2.260%
2023-03-142.590%2.430%
2023-02-212.220%2.590%
2023-01-171.990%2.220%
2022-11-222.110%1.990%
2022-09-270.710%2.110%
2022-08-160.960%0.710%
2022-07-191.410%0.960%
2022-06-280.790%1.410%
2022-05-310.730%0.790%
2022-05-100.640%0.730%
2022-04-190.210%0.640%
2022-03-220.040%0.210%
2022-02-15-0.290%0.040%
2022-01-18-0.580%-0.290%
2021-12-01-0.500%-0.580%
2021-11-03-0.540%-0.500%
2021-10-06-0.690%-0.540%
2021-09-01-0.760%-0.690%
2021-08-04-0.590%-0.760%
2021-07-07-0.570%-0.590%
2021-06-02-0.610%-0.570%
2021-05-05-0.660%-0.610%
2021-04-07-0.620%-0.660%
2021-03-10-0.690%-0.620%
2021-02-10-0.700%-0.690%
2021-01-13-0.720%-0.700%
2020-11-04-0.730%-0.720%
2020-09-30-0.690%-0.730%
2020-09-02-0.720%-0.690%
2020-08-05-0.660%-0.720%
2020-07-08-0.620%-0.660%
2020-06-03-0.740%-0.620%
2020-05-06-0.660%-0.740%
2020-04-01-0.690%-0.660%
2020-02-26-0.590%-0.690%
2020-01-29-0.600%-0.590%
2019-11-27-0.580%-0.600%
2019-10-30-0.770%-0.580%
2019-10-02-0.880%-0.770%
2019-09-04-0.790%-0.880%
2019-08-07-0.660%-0.790%
2019-07-03-0.560%-0.660%
2019-05-29-0.460%-0.560%
2019-05-08-0.410%-0.460%
2019-04-10-0.320%-0.410%
2019-03-20-0.360%-0.320%
2019-02-20-0.290%-0.360%
2019-01-23-0.220%-0.290%
2018-11-21-0.180%-0.220%
2018-10-24-0.040%-0.180%
2018-09-26-0.180%-0.040%
2018-08-29-0.180%-0.180%
2018-07-25-0.190%-0.180%
2018-06-06-0.040%-0.190%
2018-05-02-0.100%-0.040%
2018-04-040.050%-0.100%
2018-03-070.080%0.050%
2018-01-31-0.390%0.080%
2017-11-08-0.260%-0.390%
2017-10-11-0.360%-0.260%
2017-09-06-0.260%-0.360%
2017-08-09-0.140%-0.260%
2017-07-05-0.460%-0.140%
2017-06-07-0.310%-0.460%
2017-05-10-0.450%-0.310%
2017-04-05-0.450%-0.450%
2017-03-08-0.280%-0.450%
2017-02-01-0.460%-0.280%
2016-10-26-0.510%-0.460%
2016-09-21-0.510%-0.510%
2016-08-24-0.510%-0.510%
2016-07-20-0.380%-0.510%
2016-06-01-0.330%-0.380%
2016-05-04-0.340%-0.330%
2016-03-30-0.360%-0.340%
2016-03-02-0.240%-0.360%
2016-02-03-0.080%-0.240%
2015-11-11-0.030%-0.080%
2015-10-140.120%-0.030%
2015-09-020.040%0.120%
2015-08-050.170%0.040%
2015-07-010.090%0.170%
2015-06-03-0.007%0.090%
2015-04-29-0.100%-0.007%
2015-04-01-0.080%-0.100%
2015-02-250.040%-0.080%
2015-01-210.140%0.040%
2014-12-030.120%0.140%
2014-11-050.140%0.120%
2014-10-080.250%0.140%
2014-09-030.280%0.250%
2014-08-060.330%0.280%
2014-07-020.450%0.330%
2014-06-040.570%0.450%
2014-05-070.660%0.570%
2014-04-020.640%0.660%
2014-03-050.630%0.640%
2014-02-050.900%0.630%
2014-01-150.680%0.900%
2013-12-040.710%0.680%
2013-11-060.810%0.710%
2013-10-091.000%0.810%
2013-09-040.640%1.000%
2013-08-070.630%0.640%
2013-07-030.540%0.630%
2013-06-050.380%0.540%
2013-05-080.330%0.380%
2013-04-030.450%0.330%
2013-03-060.680%0.450%
2013-02-060.530%0.680%
2013-01-090.410%0.530%
2012-11-280.420%0.410%
2012-11-070.530%0.420%
2012-10-100.610%0.530%
2012-09-120.310%0.610%
2012-08-010.520%0.310%
2012-07-040.410%0.520%
2012-06-060.560%0.410%
2012-05-090.800%0.560%
2012-04-040.790%0.800%
2012-03-070.910%0.790%
2012-02-0800.910%
10:30
5-Year Treasury Gilt Auction 4,004%   4,088%
OpisThe figures displayed in the calendar represent the yield on the Treasury Gilt auctioned.U.K. Treasury Gilts have maturities up to 50 years. Governments issue treasuries to borrow money to cover the gap between the amount they receive in taxes and the amount they spend to refinance existing debt and/or to raise capital. The rate on a Treasury Gilt represents the return an investor will receive by holding the note for its entire duration. All bidders receive the same rate at the highest accepted bid.Yield fluctuations should be monitored closely as an indicator of the government debt situation. Investors compare the average rate at auction to the rate at previous auctions of the same security.
PriorytetNiski
DataPoprzednia wartośćKolejna wartośćPrzewidywana wartość
2025-11-044.004%3.845%
2025-10-234.095%4.004%
2025-10-084.095%4.095%
2025-09-244.022%4.095%
2025-08-124.078%4.022%
2025-07-174.060%4.078%
2025-06-173.977%4.060%
2025-05-074.142%3.977%
2025-04-094.311%4.142%
2025-03-054.276%4.311%
2025-02-044.490%4.276%
2025-01-084.348%4.490%
2024-12-174.148%4.348%
2024-10-293.880%4.148%
2024-10-023.811%3.880%
2024-09-053.854%3.811%
2024-08-074.023%3.854%
2024-07-174.083%4.023%
2024-06-184.199%4.083%
2024-05-224.251%4.199%
2024-04-303.928%4.251%
2024-03-264.314%3.928%
2024-03-054.095%4.314%
2024-02-214.131%4.095%
2024-02-073.946%4.131%
2024-01-244.041%3.946%
2023-12-124.474%4.041%
2023-11-014.803%4.474%
2023-09-064.575%4.803%
2023-07-194.932%4.575%
2023-06-203.958%4.932%
2023-05-174.039%3.958%
2023-04-193.497%4.039%
2023-04-053.746%3.497%
2023-03-223.351%3.746%
2023-02-073.665%3.351%
2023-01-053.472%3.665%
2022-12-063.626%3.472%
2022-11-104.800%3.626%
2022-10-121.518%4.800%
2022-06-071.518%1.518%
2022-04-050.952%1.518%
2022-03-020.988%0.952%
2022-01-110.789%0.988%
2021-10-260.429%0.789%
2021-09-140.324%0.429%
2021-08-240.334%0.324%
2021-07-270.465%0.334%
2021-06-080.457%0.465%
2021-05-110.468%0.457%
2021-04-070.454%0.468%
2021-03-020.039%0.454%
2021-02-02-0.049%0.039%
2020-08-11-0.033%-0.049%
2020-07-020.037%-0.033%
2020-05-140.168%0.037%
2020-04-210.117%0.168%
2020-03-190.222%0.117%
2020-03-040.536%0.222%
2020-01-140.561%0.536%
2019-09-030.367%0.561%
2019-08-060.620%0.367%
2019-07-020.612%0.620%
2019-06-040.849%0.612%
2019-05-090.748%0.849%
2019-04-020.966%0.748%
2019-03-061.018%0.966%
2019-01-170.966%1.018%
2018-12-041.304%0.966%
2018-09-061.094%1.304%
2018-07-241.042%1.094%
2018-06-061.117%1.042%
2018-05-031.094%1.117%
2018-04-041.115%1.094%
2018-03-010.993%1.115%
2018-01-180.889%0.993%
2017-12-050.635%0.889%
2017-08-230.769%0.635%
2017-07-190.462%0.769%
2017-06-060.613%0.462%
2017-04-200.613%0.613%
2017-03-280.578%0.613%
2017-03-020.540%0.578%
2016-08-020.863%0.540%
2016-06-010.861%0.863%
2016-03-021.117%0.861%
2016-01-201.257%1.117%
2015-05-141.408%1.257%
2015-03-031.583%1.408%
2013-10-171.652%1.583%
2013-09-191.405%1.652%
2013-08-061.422%1.405%
2013-06-200.967%1.422%
2012-11-200.802%0.967%
2012-09-200.942%0.802%
2012-07-040.927%0.942%
2012-06-121.147%0.927%
2012-04-1101.147%
11:00
CBI Distributive Trades Survey (Nov) -27 -29 -32
OpisThe Confederation of British Industry (CBI) Distributive Trades Survey (DTS) measures the health of the retail sector. The reading is compiled from a survey of about 150 retail and wholesale companies. It includes measures of sales activity across the distributive trades. It is a leading indicator of consumer spending. The figure is the difference between the percentage of retailers reporting an increase in sales and those reporting a decrease.A higher than expected reading should be taken as positive/bullish for the GBP, while a lower than expected reading should be taken as negative/bearish for the GBP.
PriorytetNiski
DataPoprzednia wartośćKolejna wartośćPrzewidywana wartość
2025-10-27-29-27-28
2025-09-25-32-29-31
2025-08-27-34-32-26
2025-07-28-46-34-28
2025-06-26-27-46-24
2025-05-27-8-27-18
2025-04-28-41-8-21
2025-03-25-23-41-28
2025-02-25-24-23-21
2025-01-24-15-24-11
2024-12-20-18-15-9
2024-11-26-6-18-14
2024-10-284-6-9
2024-09-27-274-17
2024-08-27-43-27-11
2024-07-29-24-43-20
2024-06-268-241
2024-05-28-448-24
2024-04-252-44-2
2024-03-25-72-13
2024-02-26-50-7-33
2024-01-25-32-50-30
2023-12-21-11-32-12
2023-11-27-36-11-30
2023-10-26-14-36-16
2023-09-25-44-14-33
2023-08-24-25-44-14
2023-07-27-9-25
2023-06-26-10-9-6
2023-05-255-1010
2023-04-26150
2023-03-2721-6
2023-02-23-232-13
2023-01-2611-23-5
2022-12-21-1911-23
2022-11-2818-192
2022-10-27-2018
2022-09-2337-2010
2022-08-25-437-7
2022-07-26-5-4
2022-06-24-1-5
2022-06-23-1-1-3
2022-05-24-35-1-30
2022-04-279-35-3
2022-03-2414910
2022-02-24281425
2022-01-2782813
2021-12-2139824
2021-11-253039
2021-10-26113013
2021-09-24601135
2021-08-24236020
2021-07-27252321
2021-06-25182514
2021-05-25201830
2021-04-27-4520-5
2021-03-25-45-45-37
2021-02-23-50-45-38
2021-01-26-3-50-28
2020-12-21-25-3-35
2020-11-24-23-25-35
2020-10-2711-231
2020-09-24-611-10
2020-08-254-68
2020-07-28-374-25
2020-06-25-50-37-34
2020-05-26-55-50-50
2020-04-28-3-55-40
2020-03-251-3-12
2020-02-25014
2020-01-28003
2019-12-19-303
2019-11-25-10-3-10
2019-10-28-16-10-20
2019-09-25-49-16-25
2019-08-22-16-49-13
2019-07-25-42-16-10
2019-06-25-27-42-10
2019-05-2413-278
2019-04-25-1813
2019-03-270-185
2019-02-22004
2019-01-25-1303
2018-12-2019-1316
2018-11-2751910
2018-10-3023527
2018-09-26292318
2018-08-23202913
2018-07-25322015
2018-06-27113210
2018-05-23-2114
2018-04-26-8-2-3
2018-03-288-87
2018-02-2212813
2018-01-25201211
2017-12-20262020
2017-11-23-36265
2017-10-2642-3615
2017-09-27-10425
2017-08-2422-1015
2017-07-27122210
2017-06-272122
2017-05-2338210
2017-04-279386
2017-03-23995
2017-02-23-895
2017-01-2635-822
2016-12-20263520
2016-11-25212612
2016-10-27-821-2
2016-09-279-87
2016-08-25-149-5
2016-07-274-141
2016-06-2874-2
2016-05-24-1377
2016-04-277-1312
2016-03-2410715
2016-02-24161012
2016-01-28191618
2015-12-2171921
2015-11-2419725
2015-10-29491935
2015-09-29244928
2015-08-26212418
2015-07-29292130
2015-06-25512932
2015-05-26125117
2015-04-29181225
2015-03-2611815
2015-02-2339134
2015-01-29613930
2014-12-19276131
2014-11-26312728
2014-10-27313125
2014-09-25373130
2014-08-28213727
2014-07-2342116
2014-06-2516424
2014-05-28301635
2014-04-24133017
2014-03-25371328
2014-02-25143715
2014-01-23341425
2013-12-1813410
2013-11-27218
2013-10-2834233
2013-09-25273424
2013-08-28172719
2013-07-2911710
2013-06-25-111-1
2013-05-29-1-113
2013-04-240-17
2013-03-268011
2013-02-2617816
2013-01-24191712
2012-12-19331925
2012-11-29303318
2012-10-306307
2012-09-26-365
2012-08-2311-315
2012-07-30421115
2012-06-27214210
2012-05-29-621-7
2012-04-260-6-4
2012-03-27-20-4
2012-02-28-22-2-14
2012-01-269-221
2011-12-20-199-13
2011-11-28-11-19-12
2011-10-27-15-11-15
2011-09-27-14-15-14
2011-08-25-5-14-10
2011-07-28-2-52
2011-06-2318-213
2011-05-24211811
2011-05-03152115
2011-03-30615-1
2011-02-2437630
2011-01-27563739
2010-12-15435641
2010-11-25364335
2010-10-28493640
2010-09-28354927
2010-08-26333525
2010-07-27-533-3
2010-06-23-18-5-17
2010-05-2713-1814
2010-04-27131316
2010-03-23231320
2010-02-25-823-1
2010-01-2713-812
2009-12-17131316
2009-11-2681311
2009-10-27386
2009-09-29-163-15
2009-08-27-15-16-11
2009-07-28-17-15-12
2009-06-24-17-17-17
2009-05-283-17-10
2009-04-28-443-40
2009-03-25-25-44-35
2009-02-24-47-25-52
2009-01-27-55-47-53
2008-12-17-46-55-41
2008-11-28-27-46-35
2008-10-28-27-27-35
2008-09-24-46-27-40
2008-08-28-36-46-30
2008-07-29-9-36-15
2008-06-25-14-9-17
2008-05-29-26-14
2008-04-291-26-3
2008-03-27-310
2008-02-264-30
2008-01-0113.004
2007-12-0110.0013.00
2007-11-0112.0010.00
2007-10-0115.0012.00
2007-09-0118.0015.00
2007-08-0117.0018.00
2007-07-0131.0017.00
2007-06-0144.0031.00
2007-05-0132.0044.00
2007-04-0119.0032.00
2007-03-0130.0019.00
2007-02-0125.0030.00
2007-01-01-9.0025.00
2006-12-01-4.00-9.00
2006-11-0114.00-4.00
2006-10-0112.0014.00
2006-09-017.0012.00
2006-08-019.007.00
2006-07-019.009.00
2006-06-012.009.00
2006-05-01-16.002.00
2006-04-01-18.00-16.00
2006-03-01-11.00-18.00
2006-02-010.00-11.00
2006-01-01-35.000.00
2005-12-01-18.00-35.00
2005-11-01-24.00-18.00
2005-10-01-18.00-24.00
2005-09-01-18.00-18.00
2005-08-01-19.00-18.00
2005-07-01-7.00-19.00
2005-06-01-14.00-7.00
2005-05-01-9.00-14.00
2005-04-012.00-9.00
2005-03-01-3.002.00
2005-02-0133.00-3.00
2005-01-0119.0033.00
2004-12-0111.0019.00
2004-11-01-9.0011.00
2004-10-012.00-9.00
2004-09-0124.002.00
2004-08-0143.0024.00
2004-07-0151.0043.00
2004-06-0130.0051.00
2004-05-0117.0030.00
2004-04-0126.0017.00
2004-03-0138.0026.00
2004-02-0133.0038.00
2004-01-0119.0033.00
2003-12-0135.0019.00
2003-11-0117.0035.00
2003-10-0112.0017.00
2003-09-0127.0012.00
2003-08-0110.0027.00
2003-07-0114.0010.00
2003-06-0110.0014.00
2003-05-01-13.0010.00
2003-04-012.00-13.00
2003-03-017.002.00
2003-02-01-3.007.00
2003-01-0121.00-3.00
2002-12-0125.0021.00
2002-11-0118.0025.00
2002-10-015.0018.00
2002-09-0116.005.00
2002-08-0116.0016.00
2002-07-0125.0016.00
2002-06-0157.0025.00
2002-05-0131.0057.00
2002-04-0133.0031.00
2002-03-0139.0033.00
2002-02-0148.0039.00
2002-01-0129.0048.00
2001-12-0119.0029.00
2001-11-0154.0019.00
2001-10-0149.0054.00
2001-09-0144.0049.00
2001-08-0130.0044.00
2001-07-0135.0030.00
2001-06-0132.0035.00
2001-05-0130.0032.00
2001-04-0132.0030.00
2001-03-0136.0032.00
2001-02-0116.0036.00
2001-01-0113.0016.00
2000-12-010.0013.00
11:30
Current Account (USD) (Oct) -9,77B -4,85B -5,12B
OpisThe Current Account index measures the difference in value between exported and imported goods, services and interest payments during the reported month. The goods portion is the same as the monthly Trade Balance figureBecause foreigners must buy the domestic currency to pay for the nation's exports the data can have a sizable affect on the BRL. A higher than expected reading should be taken as positive/bullish for the BRL , while a lower than expected reading should be taken as negative/bearish for the BRL.
PriorytetNiski
DataPoprzednia wartośćKolejna wartośćPrzewidywana wartość
2025-10-24-4.67B-9.77B-7.50B
2025-09-26-7.07B-4.67B-5.50B
2025-08-26-5.13B-7.07B-5.50B
2025-07-25-2.93B-5.13B-4.36B
2025-06-25-1.35B-2.93B-2.80B
2025-05-26-2.25B-1.35B-2.00B
2025-04-28-8.76B-2.25B-2.95B
2025-03-26-8.65B-8.76B-9.10B
2025-02-27-9.00B-8.65B-8.30B
2025-01-24-3.20B-9.00B
2024-12-23-5.88B-3.20B-3.20B
2024-11-25-6.50B-5.88B-6.00B
2024-10-29-6.90B-6.50B-5.00B
2024-09-25-5.20B-6.90B-5.10B
2024-08-26-4.40B-5.20B-4.00B
2024-07-25-3.40B-4.40B-3.00B
2024-06-24-2.50B-3.40B
2024-05-24-4.58B-2.50B-1.10B
2024-05-02-4.37B-4.58B-3.05B
2024-04-04-5.07B-4.37B-3.55B
2024-03-06-5.80B-5.07B-5.60B
2024-02-05-1.60B-5.80B-7.43B
2024-01-03-0.23B-1.60B-0.40B
2023-12-04-1.09B-0.23B-0.40B
2023-11-06-0.78B-1.09B-1.40B
2023-09-25-3.60B-0.78B
2023-08-25-1.27B-3.60B-4.00B
2023-07-260.65B-1.27B1.00B
2023-06-26-1.68B0.65B1.50B
2023-05-260.29B-1.68B-0.10B
2023-04-25-2.82B0.29B-5.00B
2023-03-27-8.79B-2.82B-5.00B
2023-02-24-10.88B-8.79B-8.20B
2023-01-26-0.06B-10.88B-6.45B
2022-12-22-5.06B-0.06B-2.10B
2022-12-21-4.63B-5.06B-2.10B
2022-11-25-5.68B-4.63B-4.90B
2022-10-24-5.43B-5.68B
2022-10-24-4.14B-5.43B-4.20B
2022-09-26-3.50B-4.14B0.50B
2022-08-26-2.78B-3.50B-1.08B
2022-08-26-2.78B-2.78B
2022-07-25-7.97B-2.78B
2022-05-25-2.41B-7.97B
2022-04-29-8.10B-2.41B-1.80B
2022-02-23-5.90B-8.10B-7.80B
2022-01-26-6.52B-5.90B-6.50B
2021-12-22-4.46B-6.52B-6.30B
2021-11-251.68B-4.46B-1.55B
2021-10-221.68B1.68B-1.55B
2021-09-24-1.58B1.68B1.00B
2021-08-252.80B-1.58B-0.65B
2021-07-273.80B2.80B3.50B
2021-06-255.66B3.80B4.00B
2021-05-26-4.00B5.66B6.20B
2021-04-26-2.30B-4.00B-2.50B
2021-03-26-7.25B-2.30B-2.40B
2021-02-24-5.40B-7.25B-7.75B
2021-01-270.20B-5.40B-5.70B
2020-12-181.37B0.20B1.00B
2020-11-252.27B1.37B1.30B
2020-10-233.54B2.27B3.00B
2020-09-231.63B3.54B2.45B
2020-08-252.24B1.63B0.74B
2020-07-281.30B2.24B3.80B
2020-06-243.84B1.30B1.90B
2020-05-260.87B3.84B3.00B
2020-04-24-3.90B0.87B
2020-03-25-11.88B-3.90B-3.45B
2020-02-21-5.69B-11.88B
2020-01-27-2.16B-5.69B
2019-12-20-7.90B-2.16B-3.60B
2019-11-25-3.50B-7.90B-5.48B
2019-10-24-4.27B-3.50B-3.95B
2019-09-23-9.04B-4.27B-3.96B
2019-08-26-2.90B-9.04B-5.90B
2019-07-250.66B-2.90B-1.50B
2019-06-24-0.06B0.66B
2019-05-27-0.49B-0.06B0.09B
2019-04-25-1.13B-0.49B0.50B
2019-03-25-6.55B-1.13B0.38B
2019-02-25-0.82B-6.55B-6.35B
2019-01-28-0.80B-0.82B
2018-12-210.34B-0.80B-1.90B
2018-11-270.03B0.34B1.00B
2018-10-25-0.72B0.03B0.39B
2018-09-24-4.40B-0.72B-1.20B
2018-08-270.44B-4.40B-3.80B
2018-07-260.73B0.44B0.04B
2018-06-250.62B0.73B0.87B
2018-05-240.80B0.62B1.10B
2018-04-250.28B0.80B
2018-03-234.30B0.28B0.33B
2018-02-26-4.30B4.30B-4.99B
2018-01-26-2.39B-4.30B-4.05B
2017-12-20-0.34B-2.39B-1.80B
2017-11-230.43B-0.34B-1.00B
2017-10-26-0.30B0.43B-0.25B
2017-09-26-3.40B-0.30B-0.19B
2017-08-231.33B-3.40B-3.20B
2017-07-212.90B1.33B1.33B
2017-06-271.20B2.90B1.80B
2017-05-231.40B1.20B1.25B
2017-04-25-0.94B1.40B0.60B
2017-03-24-5.10B-0.94B0.40B
2017-02-17-5.88B-5.10B-5.30B
2017-01-24-0.88B-5.88B-4.50B
2016-12-20-3.34B-0.88B-0.20B
2016-11-22-0.47B-3.34B-3.10B
2016-10-25-0.58B-0.47B-1.85B
2016-09-26-4.05B-0.58B-0.85B
2016-08-23-2.48B-4.05B-3.60B
2016-07-261.20B-2.48B-1.50B
2016-06-240.40B1.20B1.90B
2016-05-24-0.86B0.40B-0.90B
2016-04-20-1.92B-0.86B-1.10B
2016-03-23-4.82B-1.92B-0.20B
2016-02-23-2.46B-4.82B-5.90B
2016-01-26-2.93B-2.46B-2.50B
2015-12-21-4.17B-2.93B-4.20B
2015-11-26-3.08B-4.17B-3.70B
2015-10-23-2.49B-3.08B-2.30B
2015-09-22-6.16B-2.49B-3.25B
2015-08-25-2.55B-6.16B-6.70B
2015-07-22-3.37B-2.55B-2.29B
2015-06-22-6.90B-3.37B-4.50B
2015-05-26-5.74B-6.90B-6.78B
2015-04-22-6.90B-5.74B-5.00B
2015-03-24-10.65B-6.90B-7.70B
2015-02-24-10.32B-10.65B-10.99B
2015-01-23-9.33B-10.32B-9.70B
2014-12-19-8.13B-9.33B-8.66B
2014-11-24-7.91B-8.13B-7.50B
2014-10-24-5.49B-7.91B-7.25B
2014-09-24-6.02B-5.49B-5.30B
2014-08-223.35B-6.02B-5.80B
2014-07-25-6.64B3.35B-3.90B
2014-06-24-8.29B-6.64B-6.65B
2014-05-23-6.25B-8.29B-6.70B
2014-04-25-7.45B-6.25B-6.45B
2014-03-24-11.59B-7.45B-8.00B
2014-02-21-8.68B-11.59B-11.70B
2014-01-24-5.15B-8.68B-6.80B
2013-12-18-7.13B-5.15B-4.80B
2013-11-22-2.63B-7.13B-7.00B
2013-10-25-5.51B-2.63B-1.80B
2013-09-24-9.02B-5.51B-5.10B
2013-08-23-3.95B-9.02B-8.40B
2013-07-23-6.42B-3.95B-4.85B
2013-06-210-6.42B-6.20B
11:30
Foreign direct investment (USD) (Oct) 10,67B   10,94B
Opis Foreign direct investment are the net inflows of investment to acquire a lasting management interest (10 percent or more of voting stock) in an enterprise operating in an economy other than that of the investor. It is the sum of equity capital, reinvestment of earnings, other long-term capital, and short-term capital as shown in the balance of payments. This series shows net outflows of investment from the reporting economy to the rest of the world and is divided by GDP. A higher than expected number should be taken as positive to the BRL, while a lower than expected number as negative.
PriorytetNiski
DataPoprzednia wartośćKolejna wartośćPrzewidywana wartość
2025-10-247.99B10.67B6.50B
2025-09-268.32B7.99B6.20B
2025-08-262.81B8.32B5.00B
2025-07-253.66B2.81B4.50B
2025-06-255.49B3.66B4.50B
2025-05-265.99B5.49B4.00B
2025-04-289.30B5.99B8.53B
2025-03-266.50B9.30B5.50B
2025-02-272.80B6.50B6.55B
2025-01-247.00B2.80B
2024-12-235.72B7.00B7.14B
2024-11-255.20B5.72B4.70B
2024-10-296.10B5.20B5.60B
2024-09-257.30B6.10B7.00B
2024-08-266.30B7.30B6.00B
2024-07-253.00B6.30B3.30B
2024-06-243.90B3.00B
2024-05-249.60B3.90B4.87B
2024-05-025.01B9.60B6.85B
2024-04-048.74B5.01B6.97B
2024-03-06-0.39B8.74B4.05B
2024-02-057.80B-0.39B5.85B
2024-01-033.31B7.80B3.90B
2023-12-043.75B3.31B4.60B
2023-11-064.27B3.75B4.70B
2023-09-254.20B4.27B
2023-08-251.88B4.20B6.56B
2023-07-265.38B1.88B6.70B
2023-06-263.31B5.38B6.59B
2023-05-267.67B3.31B6.80B
2023-04-256.45B7.67B10.18B
2023-03-276.88B6.45B10.18B
2023-02-245.57B6.88B7.08B
2023-01-268.34B5.57B5.70B
2022-12-225.54B8.34B7.10B
2022-12-215.54B5.54B7.10B
2022-11-259.19B5.54B6.50B
2022-10-248.85B9.19B
2022-10-247.72B8.85B5.36B
2022-09-264.48B7.72B3.10B
2022-09-264.48B4.48B
2022-08-267.58B4.48B4.95B
2022-08-267.58B7.58B
2022-07-254.71B7.58B
2022-04-294.70B4.71B10.16B
2022-02-23-3.90B4.70B3.50B
2022-01-264.59B-3.90B3.10B
2021-12-222.49B4.59B3.80B
2021-11-254.50B2.49B4.00B
2021-10-224.45B4.50B5.00B
2021-09-246.10B4.45B6.00B
2021-08-250.17B6.10B4.45B
2021-07-271.20B0.17B2.50B
2021-06-253.54B1.20B2.50B
2021-05-266.86B3.54B5.00B
2021-04-269.00B6.86B7.50B
2021-03-261.80B9.00B6.10B
2021-02-240.74B1.80B2.84B
2021-01-271.51B0.74B3.00B
2020-12-181.79B1.51B1.35B
2020-11-252.09B1.79B1.05B
2020-10-231.43B2.09B2.10B
2020-09-232.69B1.43B1.35B
2020-08-254.75B2.69B2.50B
2020-07-282.55B4.75B3.58B
2020-06-240.23B2.55B1.65B
2020-05-267.62B0.23B1.90B
2020-04-246.00B7.62B
2020-03-255.62B6.00B6.00B
2020-02-219.43B5.62B
2020-01-276.99B9.43B
2019-12-206.80B6.99B7.50B
2019-11-256.31B6.80B7.50B
2019-10-249.47B6.31B4.20B
2019-09-237.66B9.47B6.00B
2019-08-262.20B7.66B7.00B
2019-07-257.10B2.20B5.75B
2019-06-246.96B7.10B
2019-05-276.80B6.96B
2019-04-258.40B6.80B8.00B
2019-03-255.87B8.40B
2019-02-258.95B5.87B4.50B
2019-01-2810.27B8.95B11.00B
2018-12-2110.38B10.27B11.00B
2018-11-277.83B10.38B8.50B
2018-10-2510.61B7.83B7.00B
2018-09-243.90B10.61B
2018-08-276.53B3.90B4.00B
2018-07-263.00B6.53B6.00B
2018-06-252.60B3.00B3.00B
2018-05-246.54B2.60B3.00B
2018-04-254.74B6.54B4.50B
2018-03-236.50B4.74B4.50B
2018-02-265.40B6.50B3.80B
2018-01-265.02B5.40B9.24B
2017-12-208.20B5.02B4.30B
2017-11-236.34B8.20B7.20B
2017-10-265.10B6.34B5.80B
2017-09-264.10B5.10B6.55B
2017-08-233.99B4.10B5.00B
2017-07-212.93B3.99B2.80B
2017-06-275.60B2.93B3.00B
2017-05-237.11B5.60B5.35B
2017-04-255.31B7.11B7.00B
2017-03-2411.50B5.31B4.70B
2017-02-1715.41B11.50B9.10B
2017-01-248.75B15.41B7.00B
2016-12-208.40B8.75B6.50B
2016-11-225.23B8.40B6.50B
2016-10-257.21B5.23B6.50B
2016-09-260.08B7.21B7.00B
2016-08-233.92B0.08B-0.50B
2016-07-266.15B3.92B4.00B
2016-06-246.82B6.15B5.80B
2016-05-245.56B6.82B6.20B
2016-04-205.92B5.56B6.00B
2016-03-235.46B5.92B5.00B
2016-02-2315.21B5.46B4.95B
2016-01-264.93B15.21B6.50B
2015-12-216.71B4.93B5.00B
2015-11-266.04B6.71B6.00B
2015-10-235.25B6.04B4.50B
2015-09-225.99B5.25B3.40B
2015-08-255.40B5.99B6.00B
2015-07-226.61B5.40B4.50B
2015-06-225.78B6.61B4.30B
2015-05-264.26B5.78B4.30B
2015-04-222.80B4.26B3.85B
2015-03-243.97B2.80B3.20B
2015-02-246.65B3.97B3.30B
2015-01-234.64B6.65B6.50B
2014-12-194.98B4.64B4.37B
2014-11-244.21B4.98B4.15B
2014-10-246.84B4.21B3.45B
2014-09-245.90B6.84B4.45B
2014-08-223.92B5.90B5.40B
2014-07-255.96B3.92B3.92B
2014-06-245.23B5.96B5.20B
2014-05-235.00B5.23B5.40B
2014-04-254.13B5.00B3.50B
2014-03-245.10B4.13B3.80B
2014-02-216.49B5.10B4.00B
2014-01-248.33B6.49B5.50B
2013-12-185.36B8.33B5.00B
2013-11-224.77B5.36B5.30B
2013-10-253.78B4.77B4.80B
2013-09-245.21B3.78B3.50B
2013-08-237.17B5.21B5.35B
2013-07-233.88B7.17B5.50B
2013-06-215.72B3.88B2.90B
2013-05-015.74B5.72B
2013-04-013.79B5.74B
2013-03-013.70B3.79B
2013-02-015.36B3.70B
2013-01-014.59B5.36B
2012-12-017.73B4.59B
2012-11-014.39B7.73B
2012-10-015.04B4.39B
2012-09-018.44B5.04B
2012-08-015.82B8.44B
2012-07-013.72B5.82B
2012-06-015.24B3.72B
2012-05-015.90B5.24B
2012-04-013.65B5.90B
2012-03-015.41B3.65B
2012-02-016.64B5.41B
2012-01-014.06B6.64B
2011-12-015.57B4.06B
2011-11-016.31B5.57B
2011-10-015.60B6.31B
2011-09-015.98B5.60B
2011-08-015.48B5.98B
2011-07-013.97B5.48B
2011-06-015.52B3.97B
2011-05-016.79B5.52B
2011-04-017.80B6.79B
2011-03-012.95B7.80B
2011-02-0115.37B2.95B
2011-01-013.74B15.37B
2010-12-016.82B3.74B
2010-11-015.42B6.82B
2010-10-012.42B5.42B
2010-09-012.64B2.42B
2010-08-010.77B2.64B
2010-07-013.59B0.77B
2010-06-012.23B3.59B
2010-05-012.08B2.23B
2010-04-012.84B2.08B
2010-03-010.59B2.84B
2010-02-015.11B0.59B
2010-01-011.60B5.11B
2009-12-011.56B1.60B
2009-11-011.82B1.56B
2009-10-011.90B1.82B
2009-09-011.29B1.90B
2009-08-011.43B1.29B
2009-07-012.48B1.43B
2009-06-013.41B2.48B
2009-05-011.44B3.41B
2009-04-011.97B1.44B
2009-03-011.93B1.97B
2009-02-018.12B1.93B
2009-01-012.18B8.12B
2008-12-013.91B2.18B
2008-11-016.24B3.91B
2008-10-014.64B6.24B
2008-09-013.27B4.64B
2008-08-012.73B3.27B
2008-07-011.31B2.73B
2008-06-013.87B1.31B
2008-05-013.08B3.87B
2008-04-010.89B3.08B
2008-03-014.83B0.89B
2008-02-010.89B4.83B
2008-01-012.53B0.89B
2007-12-013.19B2.53B
2007-11-011.54B3.19B
2007-10-011.98B1.54B
2007-09-013.61B1.98B
2007-08-0110.32B3.61B
2007-07-010.50B10.32B
2007-06-013.47B0.50B
2007-05-012.77B3.47B
2007-04-011.38B2.77B
2007-03-012.42B1.38B
2007-02-012.46B2.42B
2007-01-012.67B2.46B
2006-12-011.72B2.67B
2006-11-011.75B1.72B
2006-10-011.26B1.75B
2006-09-011.59B1.26B
2006-08-011.03B1.59B
2006-07-011.58B1.03B
2006-06-010.79B1.58B
2006-05-011.66B0.79B
2006-04-010.85B1.66B
2006-03-011.47B0.85B
2006-02-011.41B1.47B
2006-01-011.17B1.41B
2005-12-010.82B1.17B
2005-11-010.03B0.82B
2005-10-011.09B0.03B
2005-09-012.03B1.09B
2005-08-011.33B2.03B
2005-07-010.71B1.33B
2005-06-013.04B0.71B
2005-05-011.40B3.04B
2005-04-010.84B1.40B
2005-03-011.20B0.84B
2005-02-013.15B1.20B
2005-01-011.32B3.15B
2004-12-011.31B1.32B
2004-11-010.65B1.31B
2004-10-016.09B0.65B
2004-09-011.59B6.09B
2004-08-010.73B1.59B
2004-07-010.21B0.73B
2004-06-010.38B0.21B
2004-05-010.70B0.38B
2004-04-011.02B0.70B
2004-03-011.02B1.02B
2004-02-011.41B1.02B
2004-01-011.95B1.41B
2003-12-010.31B1.95B
2003-11-010.74B0.31B
2003-10-010.98B0.74B
2003-09-011.25B0.98B
2003-08-010.19B1.25B
2003-07-010.54B0.19B
2003-06-010.80B0.54B
2003-05-010.28B0.80B
2003-04-010.79B0.28B
2003-03-010.91B0.79B
2003-02-011.50B0.91B
2003-01-011.15B1.50B
2002-12-011.24B1.15B
2002-11-011.24B1.24B
2002-10-010.88B1.24B
2002-09-010.93B0.88B
2002-08-011.53B0.93B
2002-07-011.43B1.53B
2002-06-011.96B1.43B
2002-05-012.39B1.96B
2002-04-010.86B2.39B
2002-03-011.48B0.86B
2002-02-013.66B1.48B
2002-01-012.18B3.66B
2001-12-011.34B2.18B
2001-11-011.49B1.34B
2001-10-011.40B1.49B
2001-09-012.49B1.40B
2001-08-011.09B2.49B
2001-07-012.04B1.09B
2001-06-012.03B2.04B
2001-05-012.09B2.03B
2001-04-011.00B2.09B
2001-03-011.66B1.00B
2001-02-012.31B1.66B
2001-01-015.72B2.31B
2000-12-012.12B5.72B
12:00
Retail Sales (YoY) (Sep) 2,4%   3,3%
OpisRetail Sales measure the change in the total value of inflation-adjusted sales at the retail level. It is the foremost indicator of consumer spending, which accounts for the majority of overall economic activity.A higher than expected reading should be taken as positive/bullish for the MXN, while a lower than expected reading should be taken as negative/bearish for the MXN.
PriorytetNiski
DataPoprzednia wartośćKolejna wartośćPrzewidywana wartość
2025-10-232.4%2.4%
2025-09-233.2%2.4%1.6%
2025-08-212.7%3.2%2.9%
2025-07-22-2.0%2.7%
2025-06-234.3%-2.0%
2025-05-21-1.1%4.3%2.2%
2025-04-232.7%-1.1%
2025-03-25-0.2%2.7%
2025-02-20-1.9%-0.2%-1.7%
2025-01-21-1.2%-1.9%-1.2%
2024-12-17-1.5%-1.2%
2024-11-21-0.8%-1.5%-1.2%
2024-10-23-0.6%-0.8%-0.4%
2024-09-23-3.1%-0.6%-0.5%
2024-08-200.3%-3.1%-1.8%
2024-07-223.2%0.3%
2024-06-20-1.7%3.2%1.5%
2024-05-203.0%-1.7%
2024-04-19-0.8%3.0%
2024-03-21-0.2%-0.8%1.2%
2024-02-212.7%-0.2%2.5%
2024-01-193.4%2.7%3.2%
2023-12-202.3%3.4%2.0%
2023-11-223.2%2.3%3.6%
2023-10-205.1%3.2%4.4%
2023-09-215.9%5.1%4.9%
2023-08-182.6%5.9%2.9%
2023-07-203.8%2.6%3.5%
2023-06-202.5%3.8%2.5%
2023-05-193.4%2.5%2.9%
2023-04-205.3%3.4%4.0%
2023-03-232.5%5.3%3.0%
2023-02-212.4%2.5%3.2%
2023-01-203.8%2.4%2.6%
2022-12-203.3%3.8%3.3%
2022-11-224.7%3.3%4.1%
2022-10-215.0%4.7%6.1%
2022-09-214.0%5.0%4.7%
2022-08-195.2%4.0%5.0%
2022-07-214.6%5.2%4.6%
2022-06-233.8%4.6%4.3%
2022-05-266.4%3.8%2.7%
2022-04-266.7%6.4%5.7%
2022-03-244.9%6.7%6.0%
2022-02-245.4%4.9%6.3%
2022-01-265.3%5.4%2.7%
2021-12-225.9%5.3%5.9%
2021-11-237.2%5.9%6.1%
2021-10-219.9%7.2%6.6%
2021-09-2417.7%9.9%11.7%
2021-08-2329.7%17.7%20.1%
2021-07-2330.1%29.7%28.7%
2021-06-232.5%30.1%30.8%
2021-05-21-6.3%2.5%0.9%
2021-04-23-7.6%-6.3%-5.4%
2021-03-25-5.9%-7.6%-8.3%
2021-02-24-5.1%-5.9%-5.6%
2021-01-26-7.1%-5.1%-5.6%
2020-12-21-7.1%-7.1%-7.6%
2020-11-25-10.8%-7.1%-7.6%
2020-10-23-12.5%-10.8%-9.7%
2020-09-23-16.6%-12.5%-11.7%
2020-08-21-23.7%-16.6%-17.4%
2020-07-22-23.8%-23.7%-18.5%
2020-06-25-1.3%-23.8%-18.4%
2020-05-222.5%-1.3%-1.0%
2020-04-232.7%2.5%1.9%
2020-03-253.2%2.7%2.2%
2020-02-262.1%3.2%2.2%
2020-01-270.4%2.1%2.2%
2019-12-202.4%0.4%2.2%
2019-11-262.6%2.4%1.9%
2019-10-252.1%2.6%1.9%
2019-09-231.0%2.1%2.0%
2019-08-212.8%1.0%2.0%
2019-07-251.6%2.8%1.5%
2019-06-250.7%1.6%1.4%
2019-05-222.5%0.7%
2019-04-250.9%2.5%
2019-03-26-1.3%0.9%
2019-02-263.4%-1.3%2.9%
2019-01-253.0%3.4%3.3%
2018-12-204.1%3.0%3.8%
2018-11-263.9%4.1%
2018-10-254.2%3.9%3.7%
2018-09-213.7%4.2%2.9%
2018-08-222.5%3.7%3.1%
2018-07-253.3%2.5%1.9%
2018-06-251.2%3.3%0.8%
2018-05-221.2%1.2%0.8%
2018-04-250.5%1.2%0.5%
2018-03-26-2.0%0.5%-0.5%
2018-02-26-1.5%-2.0%-1.1%
2018-01-25-0.1%-1.5%-1.0%
2017-12-20-0.3%-0.1%0.4%
2017-11-23-0.2%-0.3%0.7%
2017-10-250.4%-0.2%0.3%
2017-09-210.4%0.4%1.2%
2017-08-234.1%0.4%2.9%
2017-07-251.4%4.1%3.1%
2017-06-236.1%1.4%3.0%
2017-05-233.6%6.1%5.3%
2017-04-264.9%3.6%3.4%
2017-03-249.0%4.9%5.1%
2017-02-2411.2%9.0%9.5%
2017-01-259.3%11.2%7.8%
2016-12-208.1%9.3%6.8%
2016-11-248.9%8.1%7.9%
2016-10-257.9%8.9%4.3%
2016-09-239.4%7.9%8.0%
2016-08-238.6%9.4%7.0%
2016-07-2510.6%8.6%6.0%
2016-06-246.4%10.6%7.5%
2016-05-239.6%6.4%5.1%
2016-04-255.2%9.6%
2016-03-233.4%5.2%4.0%
2016-02-225.7%3.4%6.1%
2016-01-264.8%5.7%5.0%
2015-12-214.9%4.8%4.7%
2015-11-236.4%4.9%7.2%
2015-10-215.8%6.4%4.8%
2015-09-235.4%5.8%5.3%
2015-08-214.1%5.4%4.3%
2015-07-224.6%4.1%4.9%
2015-06-225.5%4.6%5.0%
2015-05-265.6%5.5%4.4%
2015-04-244.7%5.6%4.2%
2015-03-202.4%4.7%2.7%
2015-02-231.2%2.4%2.0%
2015-01-265.6%1.2%3.8%
2014-12-184.5%5.6%3.9%
2014-11-204.4%4.5%3.0%
2014-10-222.0%4.4%2.7%
2014-09-231.1%2.0%2.2%
2014-08-251.6%1.1%1.6%
2014-07-22-0.4%1.6%0.5%
2014-06-201.7%-0.4%-0.2%
2014-05-21-1.7%1.7%-1.5%
2014-04-23-0.3%-1.7%1.2%
2014-03-212.2%-0.3%0.2%
2014-02-251.9%2.2%0.3%
2014-01-24-1.1%1.9%0.8%
2013-12-19-4.0%-1.1%-2.0%
2013-11-20-2.2%-4.0%-2.5%
2013-10-211.3%-2.2%1.2%
2013-09-23-1.9%1.3%0.5%
2013-08-210.1%-1.9%-0.5%
2013-07-222.5%0.1%1.1%
2013-06-20-2.4%2.5%1.9%
2013-05-22-2.6%-2.4%-0.3%
2013-04-221.8%-2.6%1.2%
2013-03-21-1.8%1.8%1.0%
2013-02-213.5%-1.8%2.1%
2013-01-233.5%3.5%3.6%
2012-12-193.8%3.5%3.4%
2012-11-214.8%3.8%3.8%
2012-10-222.6%4.8%3.3%
2012-09-205.6%2.6%4.2%
2012-08-225.2%5.6%4.0%
2012-07-192.5%5.2%4.3%
2012-06-204.3%2.5%2.9%
2012-05-227.6%4.3%5.6%
2012-04-234.4%7.6%5.0%
2012-03-213.5%4.4%4.0%
2012-02-227.5%3.5%6.5%
2012-01-263.0%7.5%3.5%
2011-12-204.7%3.0%4.2%
2011-11-232.7%4.7%3.1%
2011-10-203.1%2.7%2.8%
2011-09-214.8%3.1%4.2%
2011-08-221.0%4.8%2.0%
2011-07-204.9%1.0%4.4%
2011-06-221.0%4.9%-1.0%
2011-05-232.7%1.0%2.5%
2011-04-263.0%2.7%3.3%
2011-03-232.6%3.0%2.8%
2011-02-232.4%2.6%2.6%
2011-01-264.4%2.4%4.6%
2010-12-204.1%4.4%4.8%
2010-11-234.4%4.1%4.8%
2010-10-202.0%4.4%2.2%
2010-09-211.5%2.0%2.0%
2010-08-235.0%1.5%4.5%
2010-07-21-0.1%5.0%1.5%
2010-06-01-0.56%-0.1%
2010-05-01-1.63%-0.56%
2010-04-01-1.58%-1.63%
2010-03-01-3.10%-1.58%
2010-02-01-0.99%-3.10%
2010-01-01-1.81%-0.99%
2009-12-01-2.99%-1.81%
2009-11-01-3.23%-2.99%
2009-10-01-3.53%-3.23%
2009-09-01-4.16%-3.53%
2009-08-01-4.39%-4.16%
2009-07-01-5.31%-4.39%
2009-06-01-6.29%-5.31%
2009-05-010.10%-6.29%
2009-04-01-6.61%0.10%
2009-03-01-3.63%-6.61%
2009-02-010-3.63%
12:00
Retail Sales (MoM) (Sep) 0,6%   0,0%
OpisRetail Sales measure the change in the total value of inflation-adjusted sales at the retail level. It is the foremost indicator of consumer spending, which accounts for the majority of overall economic activity.A higher than expected reading should be taken as positive/bullish for the MXN, while a lower than expected reading should be taken as negative/bearish for the MXN.
PriorytetNiski
DataPoprzednia wartośćKolejna wartośćPrzewidywana wartość
2025-10-230.1%0.6%0.2%
2025-09-23-0.4%0.1%-0.1%
2025-08-211.8%-0.4%0.0%
2025-07-22-1.0%1.8%
2025-06-230.5%-1.0%
2025-05-210.2%0.5%0.1%
2025-04-230.6%0.2%
2025-03-250.1%0.6%
2025-02-20-0.1%0.1%-0.4%
2025-01-21-0.3%-0.1%0.3%
2024-12-170.1%-0.3%
2024-11-210.1%0.1%0.1%
2024-10-230.7%0.1%0.2%
2024-09-23-0.5%0.7%
2024-08-200.0%-0.5%
2024-07-220.5%0.0%
2024-06-20-0.2%0.5%-0.3%
2024-05-200.5%-0.2%
2024-04-19-0.6%0.5%
2024-03-21-0.9%-0.6%0.4%
2024-02-210.1%-0.9%0.2%
2024-01-190.7%0.1%0.5%
2023-12-20-0.2%0.7%0.0%
2023-11-22-0.5%-0.2%0.3%
2023-10-200.2%-0.5%0.0%
2023-09-212.3%0.2%0.2%
2023-08-18-0.5%2.3%0.9%
2023-07-201.5%-0.5%0.3%
2023-06-200.0%1.5%-0.3%
2023-05-19-0.3%0.0%0.1%
2023-04-201.6%-0.3%0.2%
2023-03-230.1%1.6%0.8%
2023-02-21-0.2%0.1%0.4%
2023-01-200.7%-0.2%0.4%
2022-12-20-0.2%0.7%0.4%
2022-11-22-0.1%-0.2%0.1%
2022-10-210.9%-0.1%0.3%
2022-09-21-0.3%0.9%0.3%
2022-08-190.5%-0.3%
2022-07-210.4%0.5%0.4%
2022-06-230.4%0.4%0.5%
2022-05-260.8%0.4%0.7%
2022-04-260.6%0.8%0.7%
2022-03-24-0.4%0.6%0.3%
2022-02-240.9%-0.4%0.3%
2022-01-260.3%0.9%0.5%
2021-12-220.2%0.3%0.5%
2021-11-230.0%0.2%0.8%
2021-10-21-0.4%0.0%-0.7%
2021-09-24-0.6%-0.4%-0.2%
2021-08-230.6%-0.6%
2021-07-23-0.4%0.6%0.3%
2021-06-233.6%-0.4%1.6%
2021-05-211.6%3.6%1.6%
2021-04-230.1%1.6%
2021-03-25-2.4%0.1%
2021-02-243.3%-2.4%1.2%
2021-01-26-1.4%3.3%1.2%
2020-12-212.7%-1.4%2.0%
2020-11-252.5%2.7%2.0%
2020-10-235.5%2.5%3.5%
2020-09-230.8%5.5%8.2%
2020-08-210.8%0.8%8.2%
2020-07-22-22.4%0.8%
2020-06-25-0.8%-22.4%-16.8%
2020-05-22-1.1%-0.8%
2020-04-230.5%-1.1%
2020-03-25-0.4%0.5%
2020-02-261.7%-0.4%-0.3%
2020-01-27-2.3%1.7%-0.1%
2019-12-200.9%-2.3%
2019-11-260.3%0.9%-0.2%
2019-10-250.0%0.3%0.1%
2019-09-23-0.5%0.0%
2019-08-210.7%-0.5%
2019-07-250.7%0.7%
2019-06-25-0.2%0.7%
2019-05-221.1%-0.2%
2019-04-251.9%1.1%
2019-03-26-3.2%1.9%
2019-02-260.4%-3.2%0.1%
2019-01-25-1.0%0.4%0.1%
2018-12-201.0%-1.0%-0.4%
2018-11-26-0.3%1.0%
2018-10-250.6%-0.3%
2018-09-210.0%0.6%0.0%
2018-08-221.0%0.0%
2018-07-25-0.8%1.0%0.5%
2018-06-250.9%-0.8%
2018-05-221.6%0.9%0.7%
2018-04-25-0.2%1.6%0.7%
2018-03-26-0.5%-0.2%
2018-02-26-0.3%-0.5%0.3%
2018-01-251.0%-0.3%0.3%
2017-12-20-0.3%1.0%-0.2%
2017-11-230.2%-0.3%0.4%
2017-10-250.3%0.2%0.1%
2017-09-21-1.1%0.3%0.4%
2017-08-23-0.1%-1.1%0.3%
2017-07-251.2%-0.1%0.1%
2017-06-23-1.3%1.2%
2017-05-232.4%-1.3%0.3%
2017-04-26-1.3%2.4%0.6%
2017-03-24-1.4%-1.3%-1.2%
2017-02-240.9%-1.4%0.3%
2017-01-251.6%0.9%
2016-12-20-0.2%1.6%
2016-11-240.6%-0.2%
2016-10-250.4%0.6%
2016-09-231.0%0.4%0.4%
2016-08-231.2%1.0%-0.2%
2016-07-25-1.4%1.2%-1.0%
2016-06-243.0%-1.4%-0.7%
2016-05-230.2%3.0%0.0%
2016-04-252.7%0.2%
2016-03-23-1.6%2.7%1.3%
2016-02-220.5%-1.6%-0.2%
2016-01-260.3%0.5%0.2%
2015-12-21-1.1%0.3%0.5%
2015-11-231.5%-1.1%-0.3%
2015-10-210.5%1.5%0.3%
2015-09-231.1%0.5%0.6%
2015-08-210.2%1.1%0.3%
2015-07-22-0.3%0.2%0.2%
2015-06-220.2%-0.3%0.4%
2015-05-260.5%0.2%-0.2%
2015-04-242.1%0.5%
2015-03-20-0.8%2.1%
2015-02-230.8%-0.8%
2015-01-26-0.1%0.8%0.3%
2014-12-18-0.7%-0.1%
2014-11-200.6%-0.7%0.1%
2014-10-220.4%0.6%0.2%
2014-09-230.2%0.4%0.2%
2014-08-25-0.1%0.2%0.4%
2014-07-221.1%-0.1%-0.8%
2014-06-201.2%1.1%0.3%
2014-05-21-1.3%1.2%-0.2%
2014-04-23-0.3%-1.3%-0.1%
2014-03-01-0.61%-0.3%
2014-02-01-0.92%-0.61%
2014-01-013.96%-0.92%
2013-12-01-0.70%3.96%
2013-11-010.05%-0.70%
2013-10-01-3.40%0.05%
2013-09-013.25%-3.40%
2013-08-01-0.99%3.25%
2013-07-012.35%-0.99%
2013-06-01-1.64%2.35%
2013-05-010.37%-1.64%
2013-04-010.23%0.37%
2013-03-013.07%0.23%
2013-02-01-4.25%3.07%
2013-01-010.05%-4.25%
2012-12-01-0.28%0.05%
2012-11-011.71%-0.28%
2012-10-010.59%1.71%
2012-09-01-0.63%0.59%
2012-08-010.43%-0.63%
2012-07-010.09%0.43%
2012-06-010.34%0.09%
2012-05-010.27%0.34%
2012-04-010.39%0.27%
2012-03-010.47%0.39%
2012-02-010.87%0.47%
2012-01-010.12%0.87%
2011-12-010.70%0.12%
2011-11-010.71%0.70%
2011-10-010.51%0.71%
2011-09-01-0.26%0.51%
2011-08-01-0.10%-0.26%
2011-07-01-0.15%-0.10%
2011-06-011.89%-0.15%
2011-05-010.02%1.89%
2011-04-01-2.54%0.02%
2011-03-012.02%-2.54%
2011-02-012.34%2.02%
2011-01-01-2.74%2.34%
2010-12-010.46%-2.74%
2010-11-01-1.27%0.46%
2010-10-010.95%-1.27%
2010-09-010.54%0.95%
2010-08-01-0.28%0.54%
2010-07-010.71%-0.28%
2010-06-01-0.07%0.71%
2010-05-01-0.45%-0.07%
2010-04-011.00%-0.45%
2010-03-01-1.25%1.00%
2010-02-011.34%-1.25%
2010-01-010.02%1.34%
2009-12-01-0.44%0.02%
2009-11-01-0.25%-0.44%
2009-10-010.12%-0.25%
2009-09-01-0.13%0.12%
2009-08-011.12%-0.13%
2009-07-01-1.91%1.12%
2009-06-01-1.18%-1.91%
2009-05-010.04%-1.18%
2009-04-010.08%0.04%
2009-03-010.25%0.08%
2009-02-010.04%0.25%
2009-01-01-0.54%0.04%
2008-12-01-0.91%-0.54%
2008-11-01-0.17%-0.91%
2008-10-01-1.36%-0.17%
2008-09-01-0.12%-1.36%
2008-08-010.95%-0.12%
2008-07-01-0.55%0.95%
2008-06-01-0.89%-0.55%
2008-05-010.36%-0.89%
2008-04-01-1.03%0.36%
2008-03-010-1.03%
13:00
M3 Money Supply (YoY) (Oct) 11,1% 10,6% 10,6%
OpisMoney Supply is the aggregate amount of monetary assets available in a country at a specific time. According to the Financial Times, Money Supply M0 and M1, also known as narrow money, includes coins and notes in circulation and other assets that are easily convertible into cash. Money Supply M2 includes M1 plus short-term time deposits in banks. Money Supply M3 includes M2 plus longer-term time deposits. A higher than expected number should be taken as negative to the PLN, while a higher than expected number as negative
PriorytetNiski
DataPoprzednia wartośćKolejna wartośćPrzewidywana wartość
2025-10-2211.1%11.1%11.1%
2025-09-2210.8%11.1%11.1%
2025-08-2510.5%10.8%10.6%
2025-07-2210.3%10.5%10.2%
2025-06-2410.4%10.3%10.2%
2025-05-2310.3%10.4%10.0%
2025-04-239.1%10.3%9.7%
2025-03-249.4%9.1%9.1%
2025-02-249.3%9.4%9.2%
2025-01-248.7%9.3%8.6%
2024-12-237.8%8.7%8.4%
2024-11-266.5%7.8%7.1%
2024-10-227.8%6.5%6.8%
2024-09-238.3%7.8%8.0%
2024-08-238.4%8.3%8.4%
2024-07-228.0%8.4%8.4%
2024-06-247.4%8.0%7.4%
2024-05-246.6%7.4%6.8%
2024-04-237.4%6.6%7.8%
2024-03-227.7%7.4%7.1%
2024-02-228.5%7.7%7.9%
2024-01-247.6%8.5%8.1%
2023-12-228.2%7.6%8.2%
2023-11-238.3%8.2%8.6%
2023-10-237.3%8.3%7.3%
2023-09-228.0%7.3%7.4%
2023-08-237.9%8.0%7.8%
2023-07-247.1%7.9%7.8%
2023-06-236.7%7.1%7.2%
2023-05-246.5%6.7%6.6%
2023-04-257.4%6.5%7.2%
2023-03-226.9%7.4%6.5%
2023-02-225.4%6.9%5.8%
2023-01-245.6%5.4%6.0%
2022-12-227.0%5.6%5.9%
2022-11-247.7%7.0%7.5%
2022-10-247.4%7.7%7.4%
2022-09-226.2%7.4%6.1%
2022-08-236.5%6.2%5.7%
2022-07-227.6%6.5%7.8%
2022-06-238.2%7.6%8.2%
2022-05-247.9%8.2%8.6%
2022-04-258.0%7.9%7.7%
2022-03-227.7%8.0%7.8%
2022-02-228.9%7.7%8.7%
2022-01-2610.1%8.9%9.9%
2021-12-228.6%10.1%9.0%
2021-11-248.6%8.6%8.5%
2021-10-229.1%8.6%8.7%
2021-09-228.8%9.1%9.2%
2021-08-237.4%8.8%8.1%
2021-07-229.0%7.4%7.9%
2021-06-2411.2%9.0%9.1%
2021-05-2514.4%11.2%12.6%
2021-04-2316.3%14.4%14.1%
2021-03-2216.8%16.3%16.6%
2021-02-2216.4%16.8%16.4%
2021-01-2616.1%16.4%16.3%
2020-12-2217.0%16.1%16.7%
2020-11-2417.0%17.0%16.8%
2020-10-2216.2%17.0%16.4%
2020-09-2216.8%16.2%16.4%
2020-08-2418.1%16.8%18.5%
2020-07-2216.0%18.1%17.5%
2020-06-2314.0%16.0%15.0%
2020-05-2511.8%14.0%11.9%
2020-04-239.4%11.8%9.6%
2020-03-239.3%9.4%9.0%
2020-02-248.3%9.3%8.8%
2020-01-249.4%8.3%9.1%
2019-12-239.3%9.4%9.2%
2019-11-269.4%9.3%9.0%
2019-10-229.9%9.4%9.8%
2019-09-239.9%9.9%10.0%
2019-08-239.3%9.9%9.5%
2019-07-229.9%9.3%10.0%
2019-06-2510.4%9.9%10.0%
2019-05-249.9%10.4%10.1%
2019-04-239.8%9.9%9.7%
2019-03-228.8%9.8%9.0%
2019-02-229.2%8.8%9.3%
2019-01-238.8%9.2%8.6%
2018-12-248.3%8.8%8.5%
2018-11-237.9%8.3%8.0%
2018-10-227.5%7.9%7.5%
2018-09-247.3%7.5%7.5%
2018-08-237.3%7.3%7.4%
2018-07-236.6%7.3%7.3%
2018-06-225.7%6.6%5.9%
2018-05-245.8%5.7%5.9%
2018-04-244.9%5.8%5.3%
2018-03-224.8%4.9%5.0%
2018-02-224.6%4.8%4.8%
2018-01-234.5%4.6%4.4%
2017-12-225.7%4.5%4.8%
2017-11-235.4%5.7%5.5%
2017-10-235.4%5.4%5.6%
2017-09-225.0%5.4%5.3%
2017-08-235.0%5.0%5.0%
2017-07-216.2%5.0%6.0%
2017-06-146.6%6.2%6.5%
2017-05-127.7%6.6%
2017-04-148.2%7.7%8.6%
2017-03-148.5%8.2%8.5%
2017-02-149.6%8.5%9.3%
2017-01-139.7%9.6%9.5%
2016-12-148.7%9.7%8.5%
2016-11-149.3%8.7%8.8%
2016-10-1410.0%9.3%9.5%
2016-09-1410.7%10.0%10.8%
2016-08-1211.4%10.7%11.2%
2016-07-1411.5%11.4%11.5%
2016-06-1411.5%11.5%11.3%
2016-05-139.0%11.5%9.8%
2016-04-1410.0%9.0%9.7%
2016-03-1410.2%10.0%10.0%
2016-02-129.1%10.2%9.5%
2016-01-149.8%9.1%9.6%
2015-12-149.2%9.8%9.2%
2015-11-138.4%9.2%8.4%
2015-10-147.3%8.4%7.7%
2015-09-148.6%7.3%7.8%
2015-08-138.3%8.6%8.1%
2015-07-147.7%8.3%7.7%
2015-06-127.2%7.7%7.7%
2015-05-148.8%7.2%8.5%
2015-04-148.8%8.8%8.5%
2015-03-138.5%8.8%8.6%
2015-02-138.4%8.5%9.2%
2015-01-148.4%8.4%8.3%
2014-12-127.7%8.4%8.1%
2014-11-147.8%7.7%7.8%
2014-10-147.4%7.8%7.8%
2014-09-126.2%7.4%6.3%
2014-08-145.2%6.2%5.5%
2014-07-145.3%5.2%5.3%
2014-06-135.4%5.3%5.5%
2014-05-145.1%5.4%5.2%
2014-04-145.3%5.1%4.8%
2014-03-145.4%5.3%5.4%
2014-02-146.1%5.4%6.1%
2014-01-145.7%6.1%5.7%
2013-12-135.9%5.7%6.4%
2013-11-146.1%5.9%5.7%
2013-10-146.1%6.1%6.6%
2013-09-136.6%6.1%6.3%
2013-08-147.0%6.6%7.1%
2013-07-126.5%7.0%6.7%
2013-06-147.4%6.5%6.5%
2013-05-016.58%7.4%
2013-04-015.52%6.58%
2013-03-014.44%5.52%
2013-02-014.53%4.44%
2013-01-015.68%4.53%
2012-12-017.99%5.68%
2012-11-017.62%7.99%
2012-10-019.78%7.62%
2012-09-0110.98%9.78%
2012-08-0110.96%10.98%
2012-07-0111.14%10.96%
2012-06-0110.18%11.14%
2012-05-019.15%10.18%
2012-04-0112.39%9.15%
2012-03-0113.71%12.39%
2012-02-0112.49%13.71%
2012-01-0111.79%12.49%
2011-12-0110.46%11.79%
2011-11-0110.18%10.46%
2011-10-018.84%10.18%
2011-09-017.51%8.84%
2011-08-017.35%7.51%
2011-07-017.81%7.35%
2011-06-019.57%7.81%
2011-05-0111.05%9.57%
2011-04-018.44%11.05%
2011-03-018.18%8.44%
2011-02-018.80%8.18%
2011-01-019.07%8.80%
2010-12-016.38%9.07%
2010-11-018.91%6.38%
2010-10-019.36%8.91%
2010-09-017.81%9.36%
2010-08-017.07%7.81%
2010-07-017.65%7.07%
2010-06-016.06%7.65%
2010-05-015.53%6.06%
2010-04-015.09%5.53%
2010-03-016.31%5.09%
2010-02-018.11%6.31%
2010-01-017.95%8.11%
2009-12-0111.87%7.95%
2009-11-019.64%11.87%
2009-10-019.03%9.64%
2009-09-0111.90%9.03%
2009-08-0114.36%11.90%
2009-07-0114.21%14.36%
2009-06-0114.42%14.21%
2009-05-0117.51%14.42%
2009-04-0117.82%17.51%
2009-03-0117.62%17.82%
2009-02-0118.63%17.62%
2009-01-0118.10%18.63%
2008-12-0117.31%18.10%
2008-11-0117.33%17.31%
2008-10-0116.84%17.33%
2008-09-0116.75%16.84%
2008-08-0116.34%16.75%
2008-07-0115.14%16.34%
2008-06-0114.95%15.14%
2008-05-0113.64%14.95%
2008-04-0113.47%13.64%
2008-03-0112.92%13.47%
2008-02-0113.39%12.92%
2008-01-0113.59%13.39%
2007-12-0113.76%13.59%
2007-11-0114.45%13.76%
2007-10-0116.15%14.45%
2007-09-0115.59%16.15%
2007-08-0114.75%15.59%
2007-07-0116.01%14.75%
2007-06-0117.79%16.01%
2007-05-0118.04%17.79%
2007-04-0118.03%18.04%
2007-03-0119.30%18.03%
2007-02-0115.96%19.30%
2007-01-0114.60%15.96%
2006-12-0112.79%14.60%
2006-11-0113.37%12.79%
2006-10-0113.01%13.37%
2006-09-0113.17%13.01%
2006-08-0112.23%13.17%
2006-07-0110.87%12.23%
2006-06-0110.37%10.87%
2006-05-0110.87%10.37%
2006-04-0112.88%10.87%
2006-03-0111.90%12.88%
2006-02-0113.14%11.90%
2006-01-0115.22%13.14%
2005-12-0111.26%15.22%
2005-11-0114.94%11.26%
2005-10-0113.83%14.94%
2005-09-0113.29%13.83%
2005-08-0113.52%13.29%
2005-07-0115.53%13.52%
2005-06-0112.15%15.53%
2005-05-0113.10%12.15%
2005-04-0111.24%13.10%
2005-03-0110.90%11.24%
2005-02-019.38%10.90%
2005-01-017.22%9.38%
2004-12-0111.21%7.22%
2004-11-017.29%11.21%
2004-10-017.93%7.29%
2004-09-017.32%7.93%
2004-08-017.58%7.32%
2004-07-016.79%7.58%
2004-06-019.00%6.79%
2004-05-016.20%9.00%
2004-04-015.51%6.20%
2004-03-015.60%5.51%
2004-02-015.83%5.60%
2004-01-015.87%5.83%
2003-12-015.10%5.87%
2003-11-013.59%5.10%
2003-10-012.26%3.59%
2003-09-011.32%2.26%
2003-08-011.98%1.32%
2003-07-011.01%1.98%
2003-06-011.63%1.01%
2003-05-011.36%1.63%
2003-04-01-0.22%1.36%
2003-03-01-0.49%-0.22%
2003-02-01-1.09%-0.49%
2003-01-01-0.08%-1.09%
2002-12-01-1.94%-0.08%
2002-11-01-0.91%-1.94%
2002-10-010.41%-0.91%
2002-09-011.98%0.41%
2002-08-013.19%1.98%
2002-07-013.88%3.19%
2002-06-013.05%3.88%
2002-05-013.83%3.05%
2002-04-017.41%3.83%
2002-03-018.18%7.41%
2002-02-019.62%8.18%
2002-01-017.89%9.62%
2001-12-0111.99%7.89%
2001-11-0113.15%11.99%
2001-10-0113.95%13.15%
2001-09-0112.86%13.95%
2001-08-017.93%12.86%
2001-07-0113.06%7.93%
2001-06-0113.71%13.06%
2001-05-0114.71%13.71%
2001-04-0114.83%14.71%
2001-03-0114.63%14.83%
2001-02-0111.86%14.63%
2001-01-0114.36%11.86%
2000-12-0115.09%14.36%
2000-11-0114.67%15.09%
13:15
ADP Employment Change Weekly -2,50K   -13,50K
OpisThe ADP weekly report provides the change in private sector employment, offering the most current view of the labor market based on ADP's fine-grained, high-frequency data. Traders often consider employment figures from ADP, America's largest payrolls provider, as the harbringer of the Bureau of Labor Statistics release of Nonfarm Payrolls. This data is released by Automatic Data Processing Inc, provides a four-week moving average of the latest total private-employment change in the US. Generally, a rise in the indicator has positive implications for consumer spending and is simulative of economic growth. Therefore, a high reading is traditionally seen as bullish for the US Dollar (USD), while a low reading is seen as bearish.
Priorytet Średni
DataPoprzednia wartośćKolejna wartośćPrzewidywana wartość
2025-11-18-11.25K-2.50K
2025-11-1114.25K-11.25K
2025-10-28014.25K
13:30
Core PPI (MoM) (Sep) -0,1% 0,2% 0,1%
OpisThe Core Producer Price Index (PPI) measures the change in the selling price of goods and services sold by producers, excluding food and energy. The PPI measures price change from the perspective of the seller. When producers pay more for goods and services, they are more likely to pass the higher costs to the consumer, so PPI is thought to be a leading indicator of consumer inflation.A higher than expected reading should be taken as positive/bullish for the USD, while a lower than expected reading should be taken as negative/bearish for the USD.
Priorytet Średni
DataPoprzednia wartośćKolejna wartośćPrzewidywana wartość
2025-09-100.7%-0.1%0.3%
2025-08-140.0%0.7%0.2%
2025-07-160.4%0.0%0.2%
2025-06-12-0.2%0.4%0.3%
2025-05-150.4%-0.2%0.3%
2025-04-110.1%0.4%0.3%
2025-03-130.5%0.1%0.3%
2025-02-130.4%0.5%0.3%
2025-01-140.2%0.4%0.3%
2024-12-120.3%0.2%0.2%
2024-11-140.2%0.3%0.3%
2024-10-110.3%0.2%0.2%
2024-09-12-0.2%0.3%0.2%
2024-08-130.3%-0.2%0.2%
2024-07-120.3%0.3%0.2%
2024-06-130.5%0.3%0.3%
2024-05-14-0.1%0.5%0.2%
2024-04-110.3%-0.1%0.2%
2024-03-140.5%0.3%0.2%
2024-02-16-0.1%0.5%0.1%
2024-01-120.0%-0.1%0.2%
2023-12-130.0%0.0%0.2%
2023-11-150.2%0.0%0.3%
2023-10-110.2%0.2%0.2%
2023-09-140.4%0.2%0.2%
2023-08-11-0.1%0.4%0.2%
2023-07-130.1%-0.1%0.2%
2023-06-140.2%0.1%0.2%
2023-05-110.0%0.2%0.2%
2023-04-130.2%0.0%0.3%
2023-03-150.1%0.2%0.4%
2023-02-160.3%0.1%0.3%
2023-01-180.2%0.3%0.1%
2022-12-090.1%0.2%0.2%
2022-11-150.2%0.1%0.3%
2022-10-120.3%0.2%0.3%
2022-09-140.3%0.3%0.3%
2022-08-110.4%0.3%0.4%
2022-07-140.6%0.4%0.5%
2022-06-140.2%0.6%0.6%
2022-05-121.2%0.2%0.6%
2022-04-130.4%1.2%0.5%
2022-03-151.0%0.4%0.6%
2022-02-150.6%1.0%0.5%
2022-01-130.9%0.6%0.5%
2021-12-140.4%0.9%0.4%
2021-11-090.2%0.4%0.5%
2021-10-140.6%0.2%0.5%
2021-09-101.0%0.6%0.5%
2021-08-121.0%1.0%0.5%
2021-07-140.7%1.0%0.5%
2021-06-150.7%0.7%0.5%
2021-05-130.7%0.7%0.4%
2021-04-090.2%0.7%0.2%
2021-03-121.2%0.2%0.2%
2021-02-170.1%1.2%0.2%
2021-01-150.1%0.1%0.2%
2020-12-110.1%0.1%0.2%
2020-11-130.4%0.1%0.2%
2020-10-140.4%0.4%0.2%
2020-09-100.5%0.4%0.2%
2020-08-11-0.3%0.5%0.1%
2020-07-10-0.1%-0.3%0.1%
2020-06-11-0.3%-0.1%-0.1%
2020-05-130.2%-0.3%0.0%
2020-04-09-0.3%0.2%0.1%
2020-03-120.5%-0.3%0.1%
2020-02-190.1%0.5%0.1%
2020-01-15-0.2%0.1%0.2%
2019-12-120.3%-0.2%0.2%
2019-11-14-0.3%0.3%0.2%
2019-10-080.3%-0.3%0.2%
2019-09-11-0.1%0.3%0.2%
2019-08-090.3%-0.1%0.2%
2019-07-120.2%0.3%0.2%
2019-06-110.1%0.2%0.2%
2019-05-090.3%0.1%0.2%
2019-04-110.1%0.3%0.2%
2019-03-130.3%0.1%0.2%
2019-02-14-0.1%0.3%0.2%
2019-01-150.3%-0.1%0.2%
2018-12-110.5%0.3%0.1%
2018-11-090.2%0.5%0.2%
2018-10-10-0.1%0.2%0.2%
2018-09-120.1%-0.1%0.2%
2018-08-090.3%0.1%0.2%
2018-07-110.3%0.3%0.2%
2018-06-130.2%0.3%0.2%
2018-05-090.3%0.2%0.2%
2018-04-100.2%0.3%0.2%
2018-03-140.4%0.2%0.2%
2018-02-15-0.1%0.4%0.2%
2018-01-110.3%-0.1%0.2%
2017-12-120.4%0.3%0.2%
2017-11-140.4%0.4%0.2%
2017-10-120.1%0.4%0.2%
2017-09-13-0.1%0.1%0.2%
2017-08-100.1%-0.1%0.2%
2017-07-130.3%0.1%0.2%
2017-06-130.4%0.3%0.2%
2017-05-110.0%0.4%0.2%
2017-04-130.3%0.0%0.2%
2017-03-140.4%0.3%0.2%
2017-02-140.2%0.4%0.2%
2017-01-130.4%0.2%0.1%
2016-12-14-0.2%0.4%0.2%
2016-11-160.2%-0.2%0.2%
2016-10-140.1%0.2%0.1%
2016-09-15-0.3%0.1%0.1%
2016-08-120.4%-0.3%0.2%
2016-07-140.3%0.4%0.1%
2016-06-150.1%0.3%0.1%
2016-05-13-0.1%0.1%0.1%
2016-04-130.0%-0.1%0.1%
2016-03-150.4%0.0%0.1%
2016-02-170.2%0.4%0.1%
2016-01-150.3%0.2%0.1%
2015-12-11-0.3%0.3%0.1%
2015-11-13-0.3%-0.3%0.1%
2015-10-140.3%-0.3%0.1%
2015-09-110.3%0.3%0.1%
2015-08-140.3%0.3%0.1%
2015-07-150.1%0.3%0.1%
2015-06-12-0.2%0.1%0.1%
2015-05-140.2%-0.2%0.1%
2015-04-14-0.5%0.2%0.1%
2015-03-13-0.1%-0.5%0.1%
2015-02-180.3%-0.1%0.1%
2015-01-150.0%0.3%0.1%
2014-12-120.4%0.0%0.1%
2014-11-180.0%0.4%0.2%
2014-10-150.1%0.0%0.1%
2014-09-160.2%0.1%0.1%
2014-08-150.2%0.2%0.2%
2014-07-16-0.1%0.2%0.2%
2014-06-130.5%-0.1%0.1%
2014-05-140.6%0.5%0.2%
2014-04-11-0.2%0.6%0.2%
2014-03-140.2%-0.2%0.1%
2014-02-190.3%0.2%0.1%
2014-01-150.1%0.3%0.1%
2013-12-130.2%0.1%0.1%
2013-11-210.1%0.2%0.1%
2013-10-290.0%0.1%0.1%
2013-09-130.1%0.0%0.1%
2013-08-140.2%0.1%0.2%
2013-07-120.1%0.2%0.1%
2013-06-140.1%0.1%0.1%
2013-05-150.2%0.1%0.1%
2013-04-120.2%0.2%0.2%
2013-03-140.2%0.2%0.2%
2013-02-200.1%0.2%0.2%
2013-01-150.1%0.1%0.1%
2012-12-13-0.2%0.1%0.2%
2012-11-140.0%-0.2%0.1%
2012-10-120.2%0.0%0.2%
2012-09-130.4%0.2%0.2%
2012-08-140.2%0.4%0.2%
2012-07-130.2%0.2%0.2%
2012-06-130.2%0.2%0.2%
2012-05-110.3%0.2%0.2%
2012-04-120.2%0.3%0.2%
2012-03-150.4%0.2%0.2%
2012-02-160.3%0.4%0.1%
2012-01-180.1%0.3%0.1%
2011-12-150.0%0.1%0.2%
2011-11-150.2%0.0%0.1%
2011-10-180.1%0.2%0.1%
2011-09-140.4%0.1%0.2%
2011-08-170.3%0.4%0.2%
2011-07-140.2%0.3%0.2%
2011-06-140.3%0.2%0.2%
2011-05-120.3%0.3%0.2%
2011-04-140.2%0.3%0.2%
2011-03-160.5%0.2%0.2%
2011-02-160.2%0.5%0.2%
2011-01-130.3%0.2%0.2%
2010-12-14-0.6%0.3%0.2%
2010-11-160.1%-0.6%0.1%
2010-10-140.1%0.1%0.1%
2010-09-160.3%0.1%0.1%
2010-08-170.1%0.3%0.1%
2010-07-150.4%0.1%0.1%
2010-06-160.2%0.4%0.1%
2010-05-180.1%0.2%0.2%
2010-04-220.1%0.1%0.1%
2010-03-170.3%0.1%0.1%
2010-02-180.0%0.3%0.2%
2010-01-200.5%0.0%0.1%
2009-12-15-0.6%0.5%0.2%
2009-11-17-0.1%-0.6%0.1%
2009-10-200.2%-0.1%0.1%
2009-09-15-0.1%0.2%0.1%
2009-08-180.5%-0.1%0.1%
2009-07-14-0.1%0.5%0.1%
2009-06-160.1%-0.1%0.1%
2009-05-140.0%0.1%0.1%
2009-04-140.2%0.0%0.1%
2009-03-170.4%0.2%0.1%
2009-02-190.2%0.4%0.1%
2009-01-150.1%0.2%0.1%
2008-12-120.4%0.1%0.1%
2008-11-180.4%0.4%0.1%
2008-10-150.2%0.4%0.2%
2008-09-120.7%0.2%0.2%
2008-08-190.2%0.7%0.2%
2008-06-170.4%0.2%0.2%
2008-05-200.2%0.4%0.2%
2008-04-150.5%0.2%0.2%
2008-03-1800.5%0.2%
13:30
Core PPI (YoY) (Sep) 2,9% 2,7% 2,6%
OpisThe Core Producer Price Index (PPI) measures the change in the selling price of goods and services sold by producers, excluding food and energy. The PPI measures price change from the perspective of the seller. When producers pay more for goods and services, they are more likely to pass the higher costs to the consumer, so PPI is thought to be a leading indicator of consumer inflation.A higher than expected reading should be taken as positive/bullish for the USD, while a lower than expected reading should be taken as negative/bearish for the USD.
PriorytetNiski
DataPoprzednia wartośćKolejna wartośćPrzewidywana wartość
2025-09-103.4%2.8%3.5%
2025-08-142.6%3.4%2.9%
2025-07-163.2%2.6%2.7%
2025-06-123.2%3.2%3.1%
2025-05-154.0%3.2%3.1%
2025-04-113.5%4.0%3.6%
2025-03-133.8%3.5%3.6%
2025-02-133.7%3.8%3.3%
2025-01-143.5%3.7%3.8%
2024-12-123.4%3.5%3.2%
2024-11-142.9%3.4%3.0%
2024-10-112.6%2.9%2.7%
2024-09-122.3%2.6%2.5%
2024-08-133.0%2.3%2.7%
2024-07-122.6%3.0%2.5%
2024-06-132.5%2.6%2.4%
2024-05-142.1%2.5%2.4%
2024-04-112.1%2.1%2.3%
2024-03-142.0%2.1%1.9%
2024-02-161.7%2.0%1.6%
2024-01-122.0%1.7%1.9%
2023-12-132.3%2.0%2.2%
2023-11-152.7%2.3%2.7%
2023-10-112.5%2.7%2.3%
2023-09-142.4%2.5%2.2%
2023-08-112.4%2.4%2.3%
2023-07-132.6%2.4%2.6%
2023-06-143.1%2.6%2.9%
2023-05-113.4%3.1%3.3%
2023-04-134.8%3.4%3.4%
2023-03-155.0%4.8%5.2%
2023-02-165.8%5.0%4.9%
2023-01-186.2%5.8%5.7%
2022-12-096.8%6.2%5.9%
2022-11-157.1%6.8%7.2%
2022-10-127.2%7.1%7.3%
2022-09-147.7%7.2%7.1%
2022-08-118.4%7.7%7.6%
2022-07-148.5%8.4%8.1%
2022-06-148.6%8.5%8.6%
2022-05-129.6%8.6%8.9%
2022-04-138.7%9.6%8.4%
2022-03-158.5%8.7%8.7%
2022-02-158.5%8.5%7.9%
2022-01-137.9%8.5%8.0%
2021-12-147.0%7.9%7.2%
2021-11-096.8%7.0%6.8%
2021-10-146.7%6.8%7.1%
2021-09-106.2%6.7%6.6%
2021-08-125.6%6.2%5.6%
2021-07-144.8%5.6%5.1%
2021-06-154.1%4.8%4.8%
2021-05-133.1%4.1%3.7%
2021-04-092.5%3.1%2.7%
2021-03-122.0%2.5%2.6%
2021-02-171.2%2.0%1.1%
2021-01-151.4%1.2%1.3%
2020-12-111.1%1.4%1.5%
2020-11-131.2%1.1%1.2%
2020-10-140.6%1.2%0.9%
2020-09-100.3%0.6%0.3%
2020-08-110.1%0.3%0.4%
2020-07-100.3%0.1%0.4%
2020-06-110.6%0.3%0.4%
2020-05-131.4%0.6%0.9%
2020-04-091.4%1.4%1.2%
2020-03-121.7%1.4%1.7%
2020-02-191.1%1.7%1.3%
2020-01-151.3%1.1%1.3%
2019-12-121.6%1.3%1.6%
2019-11-142.0%1.6%1.5%
2019-10-082.3%2.0%2.3%
2019-09-112.1%2.3%2.2%
2019-08-092.3%2.1%2.4%
2019-07-122.3%2.3%2.2%
2019-06-112.4%2.3%2.3%
2019-05-092.4%2.4%2.5%
2019-04-112.5%2.4%2.4%
2019-03-132.6%2.5%2.6%
2019-02-142.7%2.6%2.5%
2019-01-152.7%2.7%2.9%
2018-12-112.6%2.7%2.5%
2018-11-092.5%2.6%2.3%
2018-10-102.3%2.5%2.5%
2018-09-122.7%2.3%2.7%
2018-08-092.8%2.7%2.8%
2018-07-112.4%2.8%2.6%
2018-06-132.3%2.4%2.3%
2018-05-092.7%2.3%2.4%
2018-04-102.5%2.7%2.6%
2018-03-142.2%2.5%2.5%
2018-02-152.3%2.2%2.1%
2018-01-112.4%2.3%2.5%
2017-12-122.4%2.4%2.3%
2017-11-142.2%2.4%2.3%
2017-10-122.0%2.2%2.0%
2017-09-131.8%2.0%2.1%
2017-08-101.9%1.8%2.1%
2017-07-132.1%1.9%2.0%
2017-06-131.9%2.1%2.0%
2017-05-111.6%1.9%1.7%
2017-04-131.5%1.6%1.8%
2017-03-141.2%1.5%1.5%
2017-02-141.6%1.2%1.1%
2017-01-131.6%1.6%1.5%
2016-12-141.2%1.6%1.3%
2016-11-161.2%1.2%1.5%
2016-10-141.0%1.2%1.2%
2016-09-150.7%1.0%1.0%
2016-08-121.3%0.7%1.2%
2016-07-141.2%1.3%1.0%
2016-06-150.9%1.2%1.0%
2016-05-131.0%0.9%1.0%
2016-04-131.2%1.0%1.3%
2016-03-150.6%1.2%1.1%
2016-02-170.3%0.6%0.4%
2016-01-150.5%0.3%0.3%
2015-12-110.1%0.5%0.2%
2015-11-130.8%0.1%0.5%
2015-10-140.9%0.8%1.2%
2015-09-110.6%0.9%0.7%
2015-08-140.8%0.6%0.5%
2015-07-150.6%0.8%0.7%
2015-06-120.8%0.6%0.7%
2015-05-140.9%0.8%1.1%
2015-04-141.0%0.9%0.9%
2015-03-131.6%1.0%1.6%
2015-02-182.1%1.6%2.0%
2015-01-151.8%2.1%1.9%
2014-12-121.8%1.8%1.8%
2014-11-181.6%1.8%1.5%
2014-10-151.8%1.6%1.8%
2014-09-161.6%1.8%1.8%
2014-08-151.8%1.6%1.6%
2014-07-162.0%1.8%1.7%
2014-06-131.9%2.0%2.3%
2014-05-141.4%1.9%1.4%
2014-04-111.1%1.4%1.1%
2014-03-141.3%1.1%1.4%
2014-02-191.2%1.3%1.4%
2014-01-151.3%1.2%1.3%
2013-12-131.4%1.3%1.4%
2013-11-211.2%1.4%1.3%
2013-10-291.1%1.2%1.2%
2013-09-131.2%1.1%1.3%
2013-08-141.7%1.2%1.4%
2013-07-121.7%1.7%1.6%
2013-06-141.7%1.7%1.7%
2013-05-151.7%1.7%1.7%
2013-04-121.7%1.7%1.7%
2013-03-141.8%1.7%1.7%
2013-02-202.0%1.8%1.6%
2013-01-152.2%2.0%2.1%
2012-12-132.1%2.2%2.2%
2012-11-142.3%2.1%2.5%
2012-10-122.5%2.3%2.5%
2012-09-132.5%2.5%2.6%
2012-08-142.6%2.5%2.3%
2012-07-132.7%2.6%2.6%
2012-06-132.7%2.7%2.8%
2012-05-112.9%2.7%2.8%
2012-04-012.60%2.9%
2012-03-012.50%2.60%
2012-02-012.60%2.50%
2012-01-012.70%2.60%
2011-12-012.70%2.70%
2011-11-012.90%2.70%
2011-10-013.00%2.90%
2011-09-012.70%3.00%
2011-08-012.60%2.70%
2011-07-012.30%2.60%
2011-06-012.50%2.30%
2011-05-0102.50%
13:30
PPI (MoM) (Sep) -0,1% 0,3% 0,3%
OpisThe Producer Price Index (PPI) measures the change in the price of goods sold by manufacturers. It is a leading indicator of consumer price inflation, which accounts for the majority of overall inflation. A higher than expected reading should be taken as positive/bullish for the USD, while a lower than expected reading should be taken as negative/bearish for the USD.
PriorytetWysoki
DataPoprzednia wartośćKolejna wartośćPrzewidywana wartość
2025-09-100.7%-0.1%0.3%
2025-08-140.0%0.7%0.2%
2025-07-160.3%0.0%0.2%
2025-06-12-0.2%0.3%0.2%
2025-05-150.0%-0.2%0.2%
2025-04-110.1%0.0%0.2%
2025-03-130.6%0.1%0.3%
2025-02-130.5%0.6%0.3%
2025-01-140.4%0.5%0.4%
2024-12-120.3%0.4%0.2%
2024-11-140.1%0.3%0.2%
2024-10-110.2%0.1%0.1%
2024-09-120.0%0.2%0.1%
2024-08-130.2%0.0%0.2%
2024-07-120.0%0.2%0.1%
2024-06-130.5%0.0%0.1%
2024-05-14-0.1%0.5%0.3%
2024-04-110.6%-0.1%0.3%
2024-03-140.3%0.6%0.3%
2024-02-16-0.1%0.3%0.1%
2024-01-12-0.1%-0.1%0.1%
2023-12-13-0.4%-0.1%0.1%
2023-11-150.4%-0.4%0.1%
2023-10-110.7%0.4%0.3%
2023-09-140.4%0.7%0.4%
2023-08-110.0%0.4%0.2%
2023-07-13-0.4%0.0%0.2%
2023-06-140.2%-0.4%-0.1%
2023-05-11-0.4%0.2%0.3%
2023-04-130.0%-0.4%0.1%
2023-03-150.3%0.0%0.3%
2023-02-16-0.2%0.3%0.4%
2023-01-180.2%-0.2%-0.1%
2022-12-090.3%0.2%0.2%
2022-11-150.2%0.3%0.4%
2022-10-12-0.2%0.2%0.2%
2022-09-14-0.4%-0.2%-0.1%
2022-08-111.0%-0.4%0.2%
2022-07-140.9%1.0%0.8%
2022-06-140.4%0.9%0.8%
2022-05-121.6%0.4%0.5%
2022-04-130.9%1.6%1.1%
2022-03-151.2%0.9%0.9%
2022-02-150.4%1.2%0.5%
2022-01-131.0%0.4%0.4%
2021-12-140.6%1.0%0.5%
2021-11-090.5%0.6%0.6%
2021-10-140.7%0.5%0.6%
2021-09-101.0%0.7%0.6%
2021-08-121.0%1.0%0.6%
2021-07-140.8%1.0%0.6%
2021-06-150.6%0.8%0.6%
2021-05-131.0%0.6%0.3%
2021-04-090.5%1.0%0.5%
2021-03-121.3%0.5%0.5%
2021-02-170.3%1.3%0.4%
2021-01-150.1%0.3%0.4%
2020-12-110.3%0.1%0.2%
2020-11-130.4%0.3%0.2%
2020-10-140.3%0.4%0.2%
2020-09-100.6%0.3%0.2%
2020-08-11-0.2%0.6%0.3%
2020-07-100.4%-0.2%0.4%
2020-06-11-1.3%0.4%0.1%
2020-05-13-0.2%-1.3%-0.5%
2020-04-09-0.6%-0.2%-0.4%
2020-03-120.5%-0.6%-0.1%
2020-02-190.2%0.5%0.1%
2020-01-150.0%0.2%0.2%
2019-12-120.4%0.0%0.2%
2019-11-14-0.3%0.4%0.3%
2019-10-080.1%-0.3%0.1%
2019-09-110.2%0.1%0.1%
2019-08-090.1%0.2%0.2%
2019-07-120.1%0.1%0.1%
2019-06-110.2%0.1%0.1%
2019-05-090.6%0.2%0.2%
2019-04-110.1%0.6%0.3%
2019-03-13-0.1%0.1%0.2%
2019-02-14-0.1%-0.1%0.1%
2019-01-150.1%-0.1%-0.1%
2018-12-110.6%0.1%0.1%
2018-11-090.2%0.6%0.2%
2018-10-10-0.1%0.2%0.2%
2018-09-120.0%-0.1%0.2%
2018-08-090.3%0.0%0.2%
2018-07-110.5%0.3%0.2%
2018-06-130.1%0.5%0.3%
2018-05-090.3%0.1%0.2%
2018-04-100.2%0.3%0.1%
2018-03-140.4%0.2%0.1%
2018-02-15-0.1%0.4%0.4%
2018-01-110.4%-0.1%0.2%
2017-12-120.4%0.4%0.4%
2017-11-140.4%0.4%0.1%
2017-10-120.2%0.4%0.4%
2017-09-13-0.1%0.2%0.3%
2017-08-100.1%-0.1%0.1%
2017-07-130.0%0.1%-0.1%
2017-06-130.5%0.0%0.1%
2017-05-11-0.1%0.5%0.2%
2017-04-130.3%-0.1%0.0%
2017-03-140.6%0.3%0.1%
2017-02-140.3%0.6%0.3%
2017-01-130.4%0.3%0.3%
2016-12-140.0%0.4%0.1%
2016-11-160.3%0.0%0.3%
2016-10-140.0%0.3%0.2%
2016-09-15-0.4%0.0%0.1%
2016-08-120.5%-0.4%0.1%
2016-07-140.4%0.5%0.3%
2016-06-150.2%0.4%0.3%
2016-05-13-0.1%0.2%0.3%
2016-04-13-0.2%-0.1%0.2%
2016-03-150.1%-0.2%-0.2%
2016-02-17-0.2%0.1%-0.2%
2016-01-150.3%-0.2%-0.2%
2015-12-11-0.4%0.3%-0.1%
2015-11-13-0.5%-0.4%0.2%
2015-10-140.0%-0.5%-0.2%
2015-09-110.2%0.0%-0.1%
2015-08-140.4%0.2%0.1%
2015-07-150.5%0.4%0.2%
2015-06-12-0.4%0.5%0.4%
2015-05-140.2%-0.4%0.2%
2015-04-14-0.5%0.2%0.2%
2015-03-13-0.8%-0.5%0.3%
2015-02-18-0.3%-0.8%-0.4%
2015-01-15-0.2%-0.3%-0.4%
2014-12-120.2%-0.2%-0.1%
2014-11-18-0.1%0.2%-0.1%
2014-10-150.0%-0.1%0.1%
2014-09-160.1%0.0%0.1%
2014-08-150.4%0.1%0.1%
2014-07-16-0.2%0.4%0.2%
2014-06-130.6%-0.2%0.1%
2014-05-140.5%0.6%0.2%
2014-04-11-0.1%0.5%0.1%
2014-03-140.2%-0.1%0.2%
2014-02-190.1%0.2%0.1%
2014-01-15-0.1%0.1%0.4%
2013-12-13-0.2%-0.1%-0.1%
2013-11-21-0.1%-0.2%-0.2%
2013-10-290.3%-0.1%0.2%
2013-09-130.0%0.3%0.2%
2013-08-140.8%0.0%0.3%
2013-07-120.5%0.8%0.5%
2013-06-14-0.7%0.5%0.1%
2013-05-15-0.6%-0.7%-0.6%
2013-04-120.7%-0.6%-0.2%
2013-03-140.2%0.7%0.7%
2013-02-20-0.3%0.2%0.4%
2013-01-15-0.8%-0.3%-0.1%
2012-12-13-0.2%-0.8%-0.5%
2012-11-141.1%-0.2%0.2%
2012-10-121.7%1.1%0.7%
2012-09-130.3%1.7%1.1%
2012-08-140.1%0.3%0.2%
2012-07-13-1.0%0.1%-0.5%
2012-06-13-0.2%-1.0%-0.6%
2012-05-110.0%-0.2%0.0%
2012-04-120.4%0.0%0.3%
2012-03-150.1%0.4%0.5%
2012-02-16-0.1%0.1%0.3%
2012-01-180.3%-0.1%0.1%
2011-12-15-0.3%0.3%0.3%
2011-11-150.8%-0.3%-0.2%
2011-10-180.0%0.8%0.2%
2011-09-140.2%0.0%0.0%
2011-08-17-0.4%0.2%0.1%
2011-07-140.2%-0.4%-0.2%
2011-06-140.8%0.2%0.1%
2011-05-120.7%0.8%0.6%
2011-04-141.6%0.7%1.0%
2011-03-160.8%1.6%0.6%
2011-02-160.9%0.8%0.8%
2011-01-130.8%0.9%0.7%
2010-12-140.4%0.8%0.5%
2010-11-160.4%0.4%0.8%
2010-10-140.4%0.4%0.2%
2010-09-160.2%0.4%0.3%
2010-08-17-0.5%0.2%0.2%
2010-07-15-0.3%-0.5%-0.1%
2010-06-16-0.1%-0.3%-0.5%
2010-05-180.7%-0.1%0.1%
2010-04-22-0.6%0.7%0.4%
2010-03-171.4%-0.6%-0.2%
2010-02-180.4%1.4%0.8%
2010-01-201.8%0.4%0.1%
2009-12-150.3%1.8%0.8%
2009-11-17-0.6%0.3%0.6%
2009-10-201.7%-0.6%0.0%
2009-09-15-0.9%1.7%0.9%
2009-08-181.8%-0.9%-0.2%
2009-07-140.2%1.8%0.9%
2009-06-160.3%0.2%0.6%
2009-05-14-1.2%0.3%0.1%
2009-04-140.1%-1.2%-0.1%
2009-03-170.8%0.1%0.3%
2009-02-19-1.9%0.8%0.2%
2009-01-15-2.2%-1.9%-2.0%
2008-12-12-2.8%-2.2%-2.0%
2008-11-18-0.4%-2.8%-1.9%
2008-10-15-0.9%-0.4%-0.4%
2008-09-121.2%-0.9%-0.5%
2008-08-191.8%1.2%0.6%
2008-07-151.4%1.8%1.3%
2008-06-170.2%1.4%1.0%
2008-05-201.1%0.2%0.4%
2008-04-150.3%1.1%0.6%
2008-03-181.0%0.3%0.3%
2008-02-2601.0%0.4%
13:30
PPI (YoY) (Sep) 2,7% 2,7% 2,7%
OpisThe Producer Price Index (PPI) measures the change in the price of goods sold by manufacturers. It is a leading indicator of consumer price inflation, which accounts for the majority of overall inflation. A higher than expected reading should be taken as positive/bullish for the USD, while a lower than expected reading should be taken as negative/bearish for the USD.
PriorytetNiski
DataPoprzednia wartośćKolejna wartośćPrzewidywana wartość
2025-09-103.1%2.6%3.3%
2025-08-142.4%3.1%2.5%
2025-07-162.7%2.4%2.5%
2025-06-122.5%2.7%2.6%
2025-05-153.4%2.5%2.5%
2025-04-113.2%3.4%3.3%
2025-03-133.7%3.2%3.3%
2025-02-133.5%3.7%3.2%
2025-01-143.0%3.5%3.5%
2024-12-122.6%3.0%2.6%
2024-11-141.9%2.6%2.3%
2024-10-111.9%1.9%1.6%
2024-09-122.1%1.9%1.8%
2024-08-132.7%2.1%2.3%
2024-07-122.4%2.7%2.3%
2024-06-132.3%2.4%2.5%
2024-05-141.8%2.3%2.2%
2024-04-111.6%1.8%2.2%
2024-03-141.0%1.6%1.1%
2024-02-161.0%1.0%0.6%
2024-01-120.8%1.0%1.3%
2023-12-131.2%0.8%1.0%
2023-11-152.2%1.2%1.9%
2023-10-112.0%2.2%1.6%
2023-09-140.8%2.0%1.2%
2023-08-110.2%0.8%0.7%
2023-07-130.9%0.2%0.4%
2023-06-142.3%0.9%1.5%
2023-05-112.7%2.3%2.4%
2023-04-134.9%2.7%3.0%
2023-03-155.7%4.9%5.4%
2023-02-166.5%5.7%5.4%
2023-01-187.3%6.5%6.8%
2022-12-098.1%7.3%7.2%
2022-11-158.4%8.1%8.3%
2022-10-128.7%8.4%8.4%
2022-09-149.8%8.7%8.8%
2022-08-1111.3%9.8%10.4%
2022-07-1410.9%11.3%10.7%
2022-06-1410.9%10.9%10.9%
2022-05-1211.5%10.9%10.7%
2022-04-1310.3%11.5%10.6%
2022-03-1510.0%10.3%10.0%
2022-02-159.8%10.0%9.1%
2022-01-139.8%9.8%9.8%
2021-12-148.8%9.8%9.2%
2021-11-098.6%8.8%8.7%
2021-10-148.3%8.6%8.7%
2021-09-107.8%8.3%8.2%
2021-08-127.3%7.8%7.3%
2021-07-146.6%7.3%6.8%
2021-06-156.2%6.6%6.3%
2021-05-134.2%6.2%5.9%
2021-04-092.8%4.2%3.8%
2021-03-121.7%2.8%2.7%
2021-02-170.8%1.7%0.9%
2021-01-150.8%0.8%0.8%
2020-12-110.5%0.8%0.8%
2020-11-130.4%0.5%0.4%
2020-10-14-0.2%0.4%0.2%
2020-09-10-0.4%-0.2%-0.3%
2020-08-11-0.8%-0.4%-0.7%
2020-07-10-0.8%-0.8%-0.2%
2020-06-11-1.2%-0.8%-1.2%
2020-05-130.7%-1.2%-0.2%
2020-04-091.3%0.7%0.5%
2020-03-122.1%1.3%1.8%
2020-02-191.3%2.1%1.6%
2020-01-151.1%1.3%1.3%
2019-12-121.1%1.1%1.2%
2019-11-141.4%1.1%0.9%
2019-10-081.8%1.4%1.8%
2019-09-111.7%1.8%1.7%
2019-08-091.7%1.7%1.7%
2019-07-121.8%1.7%1.6%
2019-06-112.2%1.8%2.0%
2019-05-092.2%2.2%2.3%
2019-04-111.9%2.2%1.9%
2019-03-132.0%1.9%1.9%
2019-02-142.5%2.0%2.1%
2019-01-152.5%2.5%2.5%
2018-12-112.9%2.5%2.5%
2018-11-092.6%2.9%2.5%
2018-10-102.8%2.6%2.8%
2018-09-123.3%2.8%3.2%
2018-08-093.4%3.3%3.4%
2018-07-113.1%3.4%3.2%
2018-06-132.6%3.1%2.8%
2018-05-093.0%2.6%2.8%
2018-04-102.8%3.0%2.9%
2018-03-142.7%2.8%2.8%
2018-02-152.6%2.7%2.5%
2018-01-113.1%2.6%3.0%
2017-12-122.8%3.1%2.9%
2017-11-142.6%2.8%2.4%
2017-10-122.4%2.6%2.5%
2017-09-131.9%2.4%2.5%
2017-08-102.0%1.9%2.2%
2017-07-132.4%2.0%1.9%
2017-06-132.5%2.4%2.3%
2017-05-112.3%2.5%2.2%
2017-04-132.2%2.3%2.4%
2017-03-141.6%2.2%2.0%
2017-02-141.6%1.6%1.5%
2017-01-131.3%1.6%1.6%
2016-12-140.8%1.3%0.9%
2016-11-160.7%0.8%1.2%
2016-10-140.0%0.7%0.6%
2016-09-15-0.2%0.0%0.1%
2016-08-120.3%-0.2%0.2%
2016-07-14-0.1%0.3%-0.1%
2016-06-150.0%-0.1%-0.1%
2016-05-13-0.1%0.0%0.2%
2016-04-130.0%-0.1%0.3%
2016-03-15-0.2%0.0%0.1%
2016-02-17-1.0%-0.2%-0.6%
2016-01-15-1.1%-1.0%-1.0%
2015-12-11-1.6%-1.1%-1.4%
2015-11-13-1.1%-1.6%-1.2%
2015-10-14-0.8%-1.1%-0.7%
2015-09-11-0.8%-0.8%-0.9%
2015-08-14-0.7%-0.8%-0.9%
2015-07-15-1.1%-0.7%-0.9%
2015-06-12-1.3%-1.1%-1.1%
2015-05-14-0.8%-1.3%-0.8%
2015-04-14-0.6%-0.8%-0.8%
2015-03-130.0%-0.6%0.0%
2015-02-181.1%0.0%0.3%
2015-01-151.4%1.1%1.0%
2014-12-121.5%1.4%1.4%
2014-11-181.6%1.5%1.2%
2014-10-151.8%1.6%1.8%
2014-09-161.7%1.8%1.8%
2014-08-151.9%1.7%1.8%
2014-07-162.0%1.9%1.8%
2014-06-132.1%2.0%2.4%
2014-05-141.4%2.1%1.7%
2014-04-110.9%1.4%1.1%
2014-03-141.2%0.9%1.2%
2014-02-191.1%1.2%1.2%
2014-01-150.7%1.1%1.1%
2013-12-130.3%0.7%0.8%
2013-11-210.3%0.3%0.3%
2013-10-291.4%0.3%0.6%
2013-09-132.1%1.4%1.3%
2013-08-142.5%2.1%2.4%
2013-07-121.7%2.5%2.1%
2013-06-140.6%1.7%1.4%
2013-05-151.1%0.6%0.8%
2013-04-121.7%1.1%1.4%
2013-03-141.4%1.7%1.7%
2013-02-201.3%1.4%1.4%
2013-01-151.5%1.3%1.4%
2012-12-132.3%1.5%1.8%
2012-11-142.1%2.3%2.6%
2012-10-122.0%2.1%1.8%
2012-09-130.5%2.0%1.4%
2012-08-140.7%0.5%0.5%
2012-07-130.7%0.7%0.2%
2012-06-131.9%0.7%1.1%
2012-05-112.8%1.9%2.1%
2012-04-012.80%2.8%
2012-03-013.10%2.80%
2012-02-013.30%3.10%
2012-01-013.70%3.30%
2011-12-013.80%3.70%
2011-11-014.50%3.80%
2011-10-014.40%4.50%
2011-09-014.40%4.40%
2011-08-014.40%4.40%
2011-07-014.10%4.40%
2011-06-014.00%4.10%
2011-05-013.90%4.00%
2011-04-013.30%3.90%
2011-03-012.50%3.30%
2011-02-012.80%2.50%
2011-01-0102.80%
13:30
PPI ex. Food/Energy/Transport (YoY) (Sep) 2,9% 2,7% 2,9%
Opis
PriorytetNiski
DataPoprzednia wartośćKolejna wartośćPrzewidywana wartość
2025-09-102.7%2.8%
2025-08-142.5%2.7%
2025-07-162.8%2.5%
2025-06-122.9%2.8%
2025-05-153.5%2.9%
2025-04-113.5%3.5%
2025-03-133.4%3.5%
2025-02-133.5%3.4%3.2%
2025-01-143.5%3.5%
2024-12-123.5%3.5%
2024-11-143.3%3.5%
2024-10-113.3%3.3%
2024-09-123.2%3.3%
2024-08-133.2%3.2%
2024-07-123.3%3.2%
2024-06-133.2%3.3%
2024-05-142.8%3.2%
2024-04-112.7%2.8%
2024-03-142.7%2.7%
2024-02-162.6%2.7%
2024-01-122.4%2.6%
2023-12-132.8%2.4%
2023-11-153.0%2.8%
2023-10-112.9%3.0%3.0%
2023-09-142.9%2.9%
2023-08-112.7%2.9%
2023-07-132.8%2.7%
2023-06-143.3%2.8%
2023-05-113.7%3.3%
2023-04-134.5%3.7%3.1%
2023-03-154.4%4.5%
2023-02-164.7%4.4%
2023-01-184.9%4.7%
2022-12-095.4%4.9%
2022-11-155.6%5.4%
2022-10-125.6%5.6%
2022-09-145.8%5.6%
2022-08-1105.8%
13:30
PPI ex. Food/Energy/Transport (MoM) (Sep) 0,3% 0,2% 0,1%
Opis
PriorytetNiski
DataPoprzednia wartośćKolejna wartośćPrzewidywana wartość
2025-09-100.6%0.3%
2025-08-140.0%0.6%
2025-07-160.1%0.0%
2025-06-12-0.1%0.1%
2025-05-150.2%-0.1%
2025-04-110.4%0.2%
2025-03-130.3%0.4%
2025-02-130.4%0.3%
2025-01-140.1%0.4%0.3%
2024-12-120.3%0.1%0.2%
2024-11-140.1%0.3%
2024-10-110.2%0.1%0.2%
2024-09-120.3%0.2%0.2%
2024-08-130.1%0.3%
2024-07-120.2%0.1%0.2%
2024-06-130.5%0.2%
2024-05-140.2%0.5%
2024-04-110.3%0.2%0.2%
2024-03-140.6%0.3%
2024-02-160.2%0.6%0.1%
2024-01-120.1%0.2%
2023-12-130.1%0.1%
2023-11-150.3%0.1%
2023-10-110.2%0.3%0.2%
2023-09-140.3%0.2%
2023-08-110.1%0.3%0.1%
2023-07-130.0%0.1%
2023-06-140.1%0.0%
2023-05-110.1%0.1%
2023-04-130.2%0.1%0.1%
2023-03-150.5%0.2%
2023-02-160.2%0.5%
2023-01-180.3%0.2%
2022-12-090.2%0.3%
2022-11-150.3%0.2%
2022-10-120.2%0.3%
2022-09-140.1%0.2%
2022-08-1100.1%
13:30
Core Retail Sales (MoM) (Sep) 0,6% 0,3% 0,3%
OpisCore Retail Sales measures the change in the total value of sales at the retail level in the U.S., excluding automobiles. It is an important indicator of consumer spending and is also considered as a pace indicator for the U.S. economy.A higher than expected reading should be taken as positive/bullish for the USD, while a lower than expected reading should be taken as negative/bearish for the USD.
PriorytetWysoki
DataPoprzednia wartośćKolejna wartośćPrzewidywana wartość
2025-09-160.4%0.7%0.4%
2025-08-150.8%0.4%0.3%
2025-07-17-0.2%0.8%0.3%
2025-06-170.0%-0.2%0.2%
2025-05-150.8%0.0%0.3%
2025-04-160.7%0.8%0.4%
2025-03-17-0.6%0.7%0.3%
2025-02-140.7%-0.6%0.3%
2025-01-160.2%0.7%0.5%
2024-12-170.2%0.2%0.4%
2024-11-151.0%0.2%0.3%
2024-10-170.2%1.0%0.1%
2024-09-170.4%0.2%0.2%
2024-08-150.5%0.4%0.1%
2024-07-160.1%0.5%0.1%
2024-06-18-0.1%0.1%0.2%
2024-05-150.9%-0.1%0.2%
2024-04-150.6%0.9%0.5%
2024-03-14-0.8%0.6%0.5%
2024-02-150.4%-0.8%0.2%
2024-01-170.2%0.4%0.2%
2023-12-140.0%0.2%-0.1%
2023-11-150.8%0.0%-0.2%
2023-10-170.9%0.8%0.2%
2023-09-140.7%0.9%0.4%
2023-08-150.2%0.7%-0.3%
2023-07-180.3%0.2%0.3%
2023-06-150.4%0.3%0.1%
2023-05-16-0.5%0.4%0.4%
2023-04-140.0%-0.5%-0.3%
2023-03-152.4%0.0%-0.1%
2023-02-15-0.9%2.4%0.8%
2023-01-18-0.6%-0.9%-0.4%
2022-12-151.2%-0.6%0.2%
2022-11-160.1%1.2%0.4%
2022-10-14-0.1%0.1%-0.1%
2022-09-150.4%-0.1%0.1%
2022-08-170.9%0.4%-0.1%
2022-07-150.6%0.9%0.6%
2022-06-150.4%0.6%0.8%
2022-05-172.1%0.4%0.4%
2022-04-140.6%2.1%1.0%
2022-03-164.4%0.6%0.9%
2022-02-16-2.8%4.4%0.8%
2022-01-140.1%-2.8%0.2%
2021-12-151.8%0.1%0.9%
2021-11-160.7%1.8%1.0%
2021-10-152.0%0.7%0.5%
2021-09-16-1.0%2.0%-0.1%
2021-08-171.6%-1.0%0.1%
2021-07-16-0.9%1.6%0.4%
2021-06-15-0.8%-0.9%0.2%
2021-05-149.0%-0.8%0.7%
2021-04-15-2.5%9.0%5.0%
2021-03-168.3%-2.5%-0.1%
2021-02-17-1.8%8.3%1.0%
2021-01-15-1.3%-1.8%-0.1%
2020-12-16-0.1%-1.3%0.1%
2020-11-171.2%-0.1%0.6%
2020-10-160.5%1.2%0.5%
2020-09-161.3%0.5%0.9%
2020-08-148.3%1.3%1.3%
2020-07-1612.1%8.3%5.0%
2020-06-16-15.2%12.1%5.5%
2020-05-15-4.0%-15.2%-8.6%
2020-04-15-0.4%-4.0%-4.8%
2020-03-170.6%-0.4%0.2%
2020-02-140.6%0.6%0.3%
2020-01-160.1%0.6%0.5%
2019-12-130.3%0.1%0.4%
2019-11-15-0.1%0.3%0.4%
2019-10-160.2%-0.1%0.2%
2019-09-131.0%0.2%0.1%
2019-08-150.3%1.0%0.4%
2019-07-160.4%0.3%0.1%
2019-06-140.5%0.4%0.5%
2019-05-151.3%0.5%0.7%
2019-04-18-0.2%1.3%0.7%
2019-04-011.4%-0.2%0.4%
2019-03-11-2.1%1.4%0.4%
2019-02-140.2%-2.1%0.0%
2018-12-141.0%0.2%0.2%
2018-11-15-0.1%1.0%0.5%
2018-10-150.2%-0.1%0.4%
2018-09-140.9%0.2%0.5%
2018-08-150.2%0.9%0.4%
2018-07-161.4%0.2%0.4%
2018-06-140.4%1.4%0.5%
2018-05-150.4%0.4%0.5%
2018-04-160.2%0.4%0.2%
2018-03-140.1%0.2%0.3%
2018-02-140.1%0.1%0.5%
2018-01-121.3%0.1%0.4%
2017-12-140.4%1.3%0.7%
2017-11-151.2%0.4%0.2%
2017-10-130.5%1.2%0.3%
2017-09-150.4%0.5%0.5%
2017-08-150.1%0.4%0.3%
2017-07-14-0.3%0.1%0.2%
2017-06-140.4%-0.3%0.2%
2017-05-120.3%0.4%0.5%
2017-04-140.2%0.3%0.1%
2017-03-151.2%0.2%0.2%
2017-02-150.4%1.2%0.4%
2017-01-130.3%0.4%0.5%
2016-12-140.6%0.3%0.4%
2016-11-150.7%0.6%0.5%
2016-10-14-0.2%0.7%0.4%
2016-09-15-0.4%-0.2%0.2%
2016-08-120.9%-0.4%0.2%
2016-07-150.4%0.9%0.4%
2016-06-140.8%0.4%0.4%
2016-05-130.4%0.8%0.5%
2016-04-13-0.1%0.4%0.4%
2016-03-15-0.4%-0.1%-0.2%
2016-02-120.1%-0.4%0.1%
2016-01-150.3%0.1%0.2%
2015-12-110.1%0.3%0.3%
2015-11-13-0.4%0.1%0.4%
2015-10-14-0.1%-0.4%-0.1%
2015-09-150.6%-0.1%0.2%
2015-08-130.4%0.6%0.4%
2015-07-140.8%0.4%0.5%
2015-06-110.1%0.8%0.7%
2015-05-130.7%0.1%0.5%
2015-04-14-0.1%0.7%0.6%
2015-03-12-1.1%-0.1%0.5%
2015-02-12-0.9%-1.1%-0.4%
2015-01-140.1%-0.9%0.1%
2014-12-110.4%0.1%0.1%
2014-11-14-0.2%0.4%0.2%
2014-10-150.3%-0.2%0.3%
2014-09-120.3%0.3%0.3%
2014-08-130.4%0.3%0.4%
2014-07-150.4%0.4%0.5%
2014-06-120.4%0.4%0.4%
2014-05-131.0%0.4%0.6%
2014-04-140.3%1.0%0.5%
2014-03-13-0.3%0.3%0.2%
2014-02-130.3%-0.3%0.1%
2014-01-140.1%0.3%0.4%
2013-12-120.5%0.1%0.2%
2013-11-200.3%0.5%0.1%
2013-10-290.1%0.3%0.4%
2013-09-130.6%0.1%0.3%
2013-08-130.1%0.6%0.4%
2013-07-150.3%0.1%0.4%
2013-06-13-0.2%0.3%0.3%
2013-05-13-0.4%-0.2%-0.1%
2013-04-121.0%-0.4%0.1%
2013-03-130.4%1.0%0.2%
2013-02-130.3%0.4%0.1%
2013-01-15-0.1%0.3%0.2%
2012-12-130.0%-0.1%-0.1%
2012-11-141.2%0.0%0.2%
2012-10-151.0%1.2%0.6%
2012-09-140.8%1.0%0.6%
2012-08-14-0.8%0.8%0.4%
2012-07-16-0.4%-0.8%0.1%
2012-06-13-0.3%-0.4%0.0%
2012-05-150.8%-0.3%0.2%
2012-04-160.9%0.8%0.6%
2012-03-131.1%0.9%0.8%
2012-02-14-0.5%1.1%0.6%
2012-01-120.3%-0.5%0.3%
2011-12-130.6%0.3%0.5%
2011-11-150.5%0.6%0.2%
2011-10-140.5%0.5%0.2%
2011-09-140.3%0.5%0.2%
2011-08-120.2%0.3%0.2%
2011-07-140.2%0.2%0.1%
2011-06-140.5%0.2%0.2%
2011-05-121.2%0.5%0.6%
2011-04-131.1%1.2%0.8%
2011-03-110.6%1.1%0.6%
2011-02-150.3%0.6%0.6%
2011-01-141.0%0.3%0.6%
2010-12-140.8%1.0%0.6%
2010-11-150.5%0.8%0.4%
2010-10-151.0%0.5%0.4%
2010-09-140.1%1.0%0.3%
2010-08-13-0.1%0.1%0.2%
2010-07-14-1.2%-0.1%-0.1%
2010-06-110.6%-1.2%0.1%
2010-05-141.2%0.6%0.5%
2010-04-141.0%1.2%0.5%
2010-03-120.5%1.0%0.1%
2010-02-12-0.2%0.5%0.4%
2010-01-141.9%-0.2%0.3%
2009-12-110.0%1.9%0.6%
2009-11-160.4%0.0%0.4%
2009-10-141.0%0.4%0.2%
2009-09-15-0.5%1.0%0.4%
2009-08-130.5%-0.5%0.2%
2009-07-140.4%0.5%0.5%
2009-06-11-0.2%0.4%0.2%
2009-05-13-1.2%-0.2%0.0%
2009-04-140.7%-1.2%0.1%
2009-03-121.6%0.7%-0.1%
2009-02-12-3.1%1.6%-0.5%
2009-01-14-1.6%-3.1%-1.3%
2008-12-12-2.2%-1.6%-1.7%
2008-11-14-0.6%-2.2%-1.1%
2008-10-15-0.7%-0.6%-0.3%
2008-09-120.4%-0.7%-0.2%
2008-08-130.8%0.4%0.5%
2008-07-151.2%0.8%0.9%
2008-06-120.5%1.2%0.7%
2008-05-130.1%0.5%0.2%
2008-04-14-0.2%0.1%0.1%
2008-03-130.3%-0.2%0.2%
2008-02-13-0.4%0.3%0.2%
2008-01-011.70%-0.4%
2007-12-010.50%1.70%
2007-11-010.50%0.50%
2007-10-01-0.10%0.50%
2007-09-010.60%-0.10%
2007-08-01-0.30%0.60%
2007-07-011.30%-0.30%
2007-06-01-0.60%1.30%
2007-05-011.20%-0.60%
2007-04-010.10%1.20%
2007-03-01-0.30%0.10%
2007-02-011.90%-0.30%
2007-01-010.00%1.90%
2006-12-01-0.20%0.00%
2006-11-01-0.60%-0.20%
2006-10-010.80%-0.60%
2006-09-010.30%0.80%
2006-08-010.00%0.30%
2006-07-01-0.10%0.00%
2006-06-010.40%-0.10%
2006-05-010.30%0.40%
2006-04-01-0.10%0.30%
2006-03-012.50%-0.10%
2006-02-010.00%2.50%
2006-01-01-0.90%0.00%
2005-12-011.30%-0.90%
2005-11-011.40%1.30%
2005-10-011.60%1.40%
2005-09-010.20%1.60%
2005-08-011.20%0.20%
2005-07-01-0.70%1.20%
2005-06-011.60%-0.70%
2005-05-010.00%1.60%
2005-04-010.90%0.00%
2005-03-010.10%0.90%
2005-02-010.80%0.10%
2005-01-010.60%0.80%
2004-12-011.20%0.60%
2004-11-010.90%1.20%
2004-10-010.10%0.90%
2004-09-010.50%0.10%
2004-08-01-0.10%0.50%
2004-07-011.10%-0.10%
2004-06-01-0.50%1.10%
2004-05-011.90%-0.50%
2004-04-010.20%1.90%
2004-03-011.10%0.20%
2004-02-010.20%1.10%
2004-01-010.80%0.20%
2003-12-010.10%0.80%
2003-11-010.00%0.10%
2003-10-011.30%0.00%
2003-09-011.00%1.30%
2003-08-011.10%1.00%
2003-07-010.30%1.10%
2003-06-01-0.70%0.30%
2003-05-011.40%-0.70%
2003-04-01-0.40%1.40%
2003-03-010.70%-0.40%
2003-02-010.20%0.70%
2003-01-010.70%0.20%
2002-12-010.80%0.70%
2002-11-010.00%0.80%
2002-10-010.00%0.00%
2002-09-010.20%0.00%
2002-08-010.10%0.20%
2002-07-01-0.30%0.10%
2002-06-011.30%-0.30%
2002-05-010.40%1.30%
2002-04-010.50%0.40%
2002-03-010.20%0.50%
2002-02-010.40%0.20%
2002-01-010.20%0.40%
2001-12-010.90%0.20%
2001-11-01-1.40%0.90%
2001-10-010.80%-1.40%
2001-09-01-0.10%0.80%
2001-08-01-0.40%-0.10%
2001-07-010.30%-0.40%
2001-06-011.50%0.30%
2001-05-01-0.90%1.50%
2001-04-01-0.20%-0.90%
2001-03-010.40%-0.20%
2001-02-010.40%0.40%
2001-01-010.20%0.40%
2000-12-010.00%0.20%
2000-11-011.50%0.00%
2000-10-010.10%1.50%
13:30
Retail Control (MoM) (Sep) 0,6% 0,3% -0,1%
Opis
Priorytet Średni
DataPoprzednia wartośćKolejna wartośćPrzewidywana wartość
2025-09-160.5%0.7%0.4%
2025-08-150.8%0.5%0.4%
2025-07-170.2%0.8%0.3%
2025-06-17-0.1%0.2%0.3%
2025-05-150.5%-0.1%0.3%
2025-04-161.3%0.5%0.6%
2025-03-17-1.0%1.3%0.2%
2025-02-140.8%-1.0%0.3%
2025-01-160.4%0.8%0.4%
2024-12-17-0.1%0.4%0.4%
2024-11-151.2%-0.1%0.3%
2024-10-170.3%1.2%
2024-09-170.4%0.3%0.3%
2024-08-150.9%0.4%
2024-07-160.4%0.9%0.2%
2024-06-18-0.5%0.4%0.4%
2024-05-151.0%-0.5%
2024-04-150.3%1.0%0.4%
2024-03-14-0.3%0.3%
2024-02-150.6%-0.3%0.2%
2024-01-170.5%0.6%
2023-12-140.2%0.5%
2023-11-150.7%0.2%
2023-10-170.2%0.7%0.1%
2023-09-140.7%0.2%
2023-08-150.5%0.7%0.2%
2023-07-180.3%0.5%-0.3%
2023-06-150.6%0.3%0.0%
2023-05-16-0.4%0.6%0.3%
2023-04-140.5%-0.4%-0.3%
2023-03-152.3%0.5%-0.3%
2023-02-15-0.7%2.3%0.8%
2023-01-18-0.2%-0.7%-0.3%
2022-12-150.5%-0.2%0.2%
2022-11-160.6%0.5%0.3%
2022-10-140.2%0.6%0.3%
2022-08-170.7%0.2%0.6%
2022-07-15-0.3%0.7%0.3%
2022-06-150.5%-0.3%0.5%
2022-05-171.1%0.5%0.5%
2022-04-14-0.9%1.1%0.2%
2022-03-166.7%-0.9%0.4%
2022-02-16-4.0%6.7%1.0%
2022-01-14-0.5%-4.0%0.1%
2021-12-151.8%-0.5%0.7%
2021-11-160.5%1.8%0.9%
2021-10-152.6%0.5%0.4%
2021-09-16-1.9%2.6%-0.1%
2021-08-171.4%-1.9%-0.1%
2021-07-16-1.4%1.4%0.4%
2021-06-15-0.4%-1.4%-0.6%
2021-05-147.6%-0.4%-0.2%
2021-04-15-3.4%7.6%6.3%
2021-03-168.7%-3.4%-0.9%
2021-02-17-2.4%8.7%0.8%
2021-01-15-1.1%-2.4%0.1%
2020-12-16-0.1%-1.1%0.2%
2020-11-170.9%-0.1%0.5%
2020-10-16-0.3%0.9%0.2%
2020-09-160.9%-0.3%0.5%
2020-08-146.0%0.9%0.8%
2020-07-1610.1%6.0%3.6%
2020-06-16-12.4%10.1%4.7%
2020-05-153.1%-12.4%-4.6%
2020-04-15-0.2%3.1%-2.0%
2020-03-170.4%-0.2%0.4%
2020-02-140.2%0.4%0.3%
2020-01-16-0.1%0.2%0.4%
2019-12-130.3%-0.1%0.3%
2019-11-150.3%0.3%
2019-10-160.3%0.3%
2019-09-130.9%0.3%0.3%
2019-08-150.7%0.9%0.3%
2019-07-160.6%0.7%0.3%
2019-06-140.4%0.6%0.4%
2019-05-151.1%0.4%0.4%
2019-04-18-0.3%1.1%0.4%
2019-04-011.7%-0.3%0.4%
2019-03-11-2.3%1.7%0.6%
2019-02-141.0%-2.3%0.4%
2018-12-140.7%1.0%0.4%
2018-11-150.3%0.7%0.4%
2018-10-150.1%0.3%0.3%
2018-09-140.8%0.1%0.4%
2018-08-15-0.1%0.8%0.4%
2018-07-160.8%-0.1%0.4%
2018-06-140.6%0.8%0.4%
2018-05-150.5%0.6%0.4%
2018-04-160.1%0.5%0.4%
2018-03-14-0.2%0.1%0.4%
2018-02-14-0.2%-0.2%0.4%
2018-01-121.4%-0.2%0.4%
2017-12-140.4%1.4%0.3%
2017-11-150.5%0.4%0.4%
2017-10-13-0.2%0.5%0.4%
2017-09-150.6%-0.2%0.3%
2017-08-150.1%0.6%0.4%
2017-07-140.0%0.1%0.3%
2017-06-140.6%0.0%0.3%
2017-05-120.7%0.6%0.4%
2017-04-14-0.2%0.7%0.3%
2017-03-150.8%-0.2%0.2%
2017-02-150.4%0.8%0.3%
2017-01-130.1%0.4%0.4%
2016-12-140.6%0.1%0.3%
2016-11-150.3%0.6%0.3%
2016-10-14-0.1%0.3%0.4%
2016-09-15-0.1%-0.1%0.3%
2016-08-120.5%-0.1%0.3%
2016-07-150.5%0.5%0.3%
2016-06-141.0%0.5%0.3%
2016-05-130.2%1.0%0.3%
2016-04-130.1%0.2%0.3%
2016-03-150.2%0.1%0.2%
2016-02-12-0.3%0.2%0.3%
2016-01-150.5%-0.3%0.3%
2015-12-110.2%0.5%0.4%
2015-11-130.1%0.2%0.4%
2015-10-140.2%0.1%0.3%
2015-09-150.6%0.2%0.4%
2015-08-130.2%0.6%0.5%
2015-07-140.7%0.2%0.4%
2015-06-110.1%0.7%0.5%
2015-05-130.5%0.1%0.5%
2015-04-14-0.2%0.5%0.5%
2015-03-12-0.1%-0.2%0.4%
2015-02-12-0.3%-0.1%0.4%
2015-01-140.6%-0.3%0.4%
2014-12-110.5%0.6%0.5%
2014-11-14-0.2%0.5%0.4%
2014-10-150.4%-0.2%0.4%
2014-09-010.20%0.4%
2014-08-010.70%0.20%
2014-07-010.00%0.70%
2014-06-010.40%0.00%
2014-05-011.10%0.40%
2014-04-010.90%1.10%
2014-03-01-1.10%0.90%
2014-02-010.80%-1.10%
2014-01-01-0.10%0.80%
2013-12-010.30%-0.10%
2013-11-010.50%0.30%
2013-10-01-0.20%0.50%
2013-09-010.50%-0.20%
2013-08-010.10%0.50%
2013-07-010.40%0.10%
2013-06-01-0.30%0.40%
2013-05-01-0.10%-0.30%
2013-04-010.20%-0.10%
2013-03-010.70%0.20%
2013-02-010.60%0.70%
2013-01-010.50%0.60%
2012-12-01-0.10%0.50%
2012-11-010.40%-0.10%
2012-10-010.00%0.40%
2012-09-010.70%0.00%
2012-08-01-0.30%0.70%
2012-07-010.30%-0.30%
2012-06-01-0.30%0.30%
2012-05-010.30%-0.30%
2012-04-010.70%0.30%
2012-03-011.20%0.70%
2012-02-01-0.60%1.20%
2012-01-010.20%-0.60%
2011-12-010.60%0.20%
2011-11-010.20%0.60%
2011-10-010.50%0.20%
2011-09-010.00%0.50%
2011-08-010.70%0.00%
2011-07-010.00%0.70%
2011-06-010.60%0.00%
2011-05-010.60%0.60%
2011-04-010.40%0.60%
2011-03-010.80%0.40%
2011-02-010.10%0.80%
2011-01-011.00%0.10%
2010-12-010.50%1.00%
2010-11-010.30%0.50%
2010-10-011.00%0.30%
2010-09-01-0.40%1.00%
2010-08-010.40%-0.40%
2010-07-01-0.20%0.40%
2010-06-01-0.10%-0.20%
2010-05-010.50%-0.10%
2010-04-010.80%0.50%
2010-03-010.20%0.80%
2010-02-010.80%0.20%
2010-01-010.00%0.80%
2009-12-010.40%0.00%
2009-11-010.20%0.40%
2009-10-010.40%0.20%
2009-09-010.00%0.40%
2009-08-010.00%0.00%
2009-07-010.30%0.00%
2009-06-010.20%0.30%
2009-05-01-1.40%0.20%
2009-04-010.00%-1.40%
2009-03-011.00%0.00%
2009-02-01-1.20%1.00%
2009-01-01-0.60%-1.20%
2008-12-01-0.90%-0.60%
2008-11-01-1.50%-0.90%
2008-10-01-0.90%-1.50%
2008-09-010.10%-0.90%
2008-08-010.40%0.10%
2008-07-010.70%0.40%
2008-06-011.20%0.70%
2008-05-010.30%1.20%
2008-04-01-0.60%0.30%
2008-03-01-0.20%-0.60%
2008-02-01-0.30%-0.20%
2008-01-011.10%-0.30%
2007-12-010.30%1.10%
2007-11-010.20%0.30%
2007-10-01-0.10%0.20%
2007-09-010.80%-0.10%
2007-08-010.10%0.80%
2007-07-010.60%0.10%
2007-06-01-0.50%0.60%
2007-05-010.90%-0.50%
2007-04-010.00%0.90%
2007-03-010.20%0.00%
2007-02-011.30%0.20%
2007-01-010.00%1.30%
2006-12-010.40%0.00%
2006-11-010.80%0.40%
2006-10-010.50%0.80%
2006-09-010.00%0.50%
2006-08-010.20%0.00%
2006-07-010.20%0.20%
2006-06-010.20%0.20%
2006-05-010.30%0.20%
2006-04-010.10%0.30%
2006-03-011.40%0.10%
2006-02-010.20%1.40%
2006-01-010.20%0.20%
2005-12-011.50%0.20%
2005-11-010.30%1.50%
2005-10-010.90%0.30%
2005-09-01-0.20%0.90%
2005-08-011.10%-0.20%
2005-07-01-0.50%1.10%
2005-06-011.60%-0.50%
2005-05-01-0.50%1.60%
2005-04-010.70%-0.50%
2005-03-010.60%0.70%
2005-02-010.80%0.60%
2005-01-010.40%0.80%
2004-12-010.90%0.40%
2004-11-010.60%0.90%
2004-10-010.30%0.60%
2004-09-010.80%0.30%
2004-08-01-0.30%0.80%
2004-07-010.70%-0.30%
2004-06-01-0.40%0.70%
2004-05-011.00%-0.40%
2004-04-01-0.10%1.00%
2004-03-010.80%-0.10%
2004-02-010.20%0.80%
2004-01-010.50%0.20%
2003-12-010.00%0.50%
2003-11-010.10%0.00%
2003-10-011.00%0.10%
2003-09-010.90%1.00%
2003-08-011.10%0.90%
2003-07-010.40%1.10%
2003-06-010.00%0.40%
2003-05-010.80%0.00%
2003-04-01-0.30%0.80%
2003-03-010.10%-0.30%
2003-02-010.30%0.10%
2003-01-010.30%0.30%
2002-12-011.00%0.30%
2002-11-01-0.20%1.00%
2002-10-010.10%-0.20%
2002-09-01-0.10%0.10%
2002-08-010.20%-0.10%
2002-07-01-0.10%0.20%
2002-06-010.50%-0.10%
2002-05-010.20%0.50%
2002-04-010.50%0.20%
2002-03-010.00%0.50%
2002-02-010.40%0.00%
2002-01-010.80%0.40%
2001-12-011.80%0.80%
2001-11-01-1.70%1.80%
2001-10-010.70%-1.70%
2001-09-010.60%0.70%
2001-08-010.00%0.60%
2001-07-01-0.30%0.00%
2001-06-011.00%-0.30%
2001-05-01-0.50%1.00%
2001-04-01-0.20%-0.50%
2001-03-01-0.20%-0.20%
2001-02-010.50%-0.20%
2001-01-010.20%0.50%
2000-12-01-0.20%0.20%
2000-11-011.50%-0.20%
2000-10-010.50%1.50%
2000-09-010.20%0.50%
13:30
Retail Sales (MoM) (Sep) 0,6% 0,4% 0,2%
OpisRetail Sales measure the change in the total value of sales at the retail level. It is the foremost indicator of consumer spending, which accounts for the majority of overall economic activity. A higher than expected reading should be taken as positive/bullish for the USD, while a lower than expected reading should be taken as negative/bearish for the USD.
PriorytetWysoki
DataPoprzednia wartośćKolejna wartośćPrzewidywana wartość
2025-09-160.6%0.6%0.2%
2025-08-150.9%0.6%0.6%
2025-07-17-0.9%0.9%0.1%
2025-06-17-0.1%-0.9%-0.5%
2025-05-151.7%-0.1%0.0%
2025-04-160.2%1.7%1.3%
2025-03-17-1.2%0.2%0.6%
2025-02-140.7%-1.2%-0.2%
2025-01-160.8%0.7%0.6%
2024-12-170.5%0.8%0.6%
2024-11-150.8%0.5%0.3%
2024-10-170.1%0.8%0.3%
2024-09-171.1%0.1%-0.2%
2024-08-15-0.2%1.1%0.4%
2024-07-160.3%-0.2%-0.3%
2024-06-18-0.2%0.3%0.3%
2024-05-150.6%-0.2%0.4%
2024-04-150.9%0.6%0.4%
2024-03-14-1.1%0.9%0.8%
2024-02-150.4%-1.1%-0.2%
2024-01-170.3%0.4%0.4%
2023-12-14-0.2%0.3%-0.1%
2023-11-150.9%-0.2%-0.3%
2023-10-170.8%0.9%0.3%
2023-09-140.5%0.8%0.2%
2023-08-150.3%0.5%0.4%
2023-07-180.5%0.3%0.5%
2023-06-150.4%0.5%-0.1%
2023-05-16-0.7%0.4%0.8%
2023-04-14-0.2%-0.7%-0.4%
2023-03-153.2%-0.2%-0.3%
2023-02-15-1.1%3.2%1.8%
2023-01-18-1.0%-1.1%-0.8%
2022-12-151.3%-1.0%-0.1%
2022-11-160.0%1.3%1.0%
2022-10-140.4%0.0%0.2%
2022-09-15-0.4%0.4%0.2%
2022-08-170.8%-0.4%0.1%
2022-07-15-0.1%0.8%0.8%
2022-06-150.7%-0.1%0.2%
2022-05-171.4%0.7%0.9%
2022-04-140.8%1.4%0.6%
2022-03-164.9%0.8%0.4%
2022-02-16-2.5%4.9%2.0%
2022-01-140.2%-2.5%-0.1%
2021-12-151.8%0.2%0.8%
2021-11-160.8%1.8%1.2%
2021-10-150.9%0.8%-0.2%
2021-09-16-1.8%0.9%-0.8%
2021-08-170.7%-1.8%-0.3%
2021-07-16-1.7%0.7%-0.4%
2021-06-150.9%-1.7%-0.8%
2021-05-1410.7%0.9%1.0%
2021-04-15-2.7%10.7%5.9%
2021-03-167.6%-2.7%-0.5%
2021-02-17-1.0%7.6%1.1%
2021-01-15-1.4%-1.0%-0.2%
2020-12-16-0.1%-1.4%-0.3%
2020-11-171.6%-0.1%0.5%
2020-10-160.6%1.6%0.7%
2020-09-160.9%0.6%1.0%
2020-08-148.4%0.9%1.9%
2020-07-1618.2%8.4%5.0%
2020-06-16-14.7%18.2%8.0%
2020-05-15-8.3%-14.7%-12.0%
2020-04-15-0.4%-8.3%-8.0%
2020-03-170.6%-0.4%0.2%
2020-02-140.2%0.6%0.3%
2020-01-160.3%0.2%0.3%
2019-12-130.4%0.3%0.5%
2019-11-15-0.3%0.4%0.2%
2019-10-160.6%-0.3%0.3%
2019-09-130.8%0.6%0.2%
2019-08-150.3%0.8%0.3%
2019-07-160.4%0.3%0.1%
2019-06-140.3%0.4%0.7%
2019-05-151.7%0.3%0.2%
2019-04-18-0.2%1.7%0.9%
2019-04-010.7%-0.2%0.3%
2019-03-11-1.6%0.7%0.0%
2019-02-140.1%-1.6%0.1%
2018-12-141.1%0.1%0.1%
2018-11-15-0.1%1.1%0.6%
2018-10-150.1%-0.1%0.7%
2018-09-140.7%0.1%0.4%
2018-08-150.2%0.7%0.2%
2018-07-161.3%0.2%0.5%
2018-06-140.4%1.3%0.4%
2018-05-150.8%0.4%0.4%
2018-04-16-0.1%0.8%0.4%
2018-03-14-0.1%-0.1%0.3%
2018-02-140.4%-0.1%0.2%
2018-01-120.9%0.4%0.4%
2017-12-140.5%0.9%0.3%
2017-11-151.9%0.5%0.1%
2017-10-13-0.1%1.9%1.7%
2017-09-150.3%-0.1%0.1%
2017-08-150.3%0.3%0.4%
2017-07-14-0.1%0.3%0.1%
2017-06-140.4%-0.1%0.1%
2017-05-120.1%0.4%0.6%
2017-04-14-0.3%0.1%-0.1%
2017-03-150.6%-0.3%0.1%
2017-02-151.0%0.6%0.1%
2017-01-130.2%1.0%0.7%
2016-12-140.6%0.2%0.3%
2016-11-151.0%0.6%0.6%
2016-10-14-0.2%1.0%0.6%
2016-09-150.1%-0.2%-0.1%
2016-08-120.8%0.1%0.4%
2016-07-150.2%0.8%0.1%
2016-06-141.3%0.2%0.3%
2016-05-13-0.3%1.3%0.8%
2016-04-13-0.1%-0.3%0.1%
2016-03-15-0.4%-0.1%-0.2%
2016-02-120.2%-0.4%0.1%
2016-01-150.4%0.2%0.1%
2015-12-110.1%0.4%0.3%
2015-11-130.1%0.1%0.3%
2015-10-140.0%0.1%0.2%
2015-09-150.7%0.0%0.3%
2015-08-130.0%0.7%0.5%
2015-07-141.0%0.0%0.2%
2015-06-110.2%1.0%1.1%
2015-05-131.1%0.2%0.2%
2015-04-14-0.5%1.1%1.0%
2015-03-12-0.8%-0.5%0.3%
2015-02-12-0.9%-0.8%-0.5%
2015-01-140.4%-0.9%-0.1%
2014-12-110.5%0.4%0.4%
2014-11-14-0.3%0.5%0.2%
2014-10-150.6%-0.3%-0.1%
2014-09-120.3%0.6%0.6%
2014-08-130.2%0.3%0.2%
2014-07-150.5%0.2%0.6%
2014-06-120.5%0.5%0.6%
2014-05-131.5%0.5%0.4%
2014-04-140.7%1.5%0.8%
2014-03-13-0.6%0.7%0.2%
2014-02-13-0.1%-0.6%0.3%
2014-01-140.4%-0.1%0.1%
2013-12-120.6%0.4%0.6%
2013-11-200.0%0.6%0.1%
2013-10-290.2%0.0%0.1%
2013-09-130.4%0.2%0.4%
2013-08-130.6%0.4%0.3%
2013-07-150.5%0.6%0.8%
2013-06-130.1%0.5%0.4%
2013-05-13-0.5%0.1%-0.3%
2013-04-121.0%-0.5%0.1%
2013-03-130.2%1.0%0.5%
2013-02-130.5%0.2%0.1%
2013-01-150.4%0.5%0.2%
2012-12-13-0.3%0.4%0.5%
2012-11-141.3%-0.3%-0.2%
2012-10-151.2%1.3%0.8%
2012-09-140.6%1.2%0.7%
2012-08-14-0.7%0.6%0.3%
2012-07-16-0.2%-0.7%0.2%
2012-06-13-0.2%-0.2%-0.2%
2012-05-150.7%-0.2%0.2%
2012-04-161.0%0.7%0.3%
2012-03-130.6%1.0%1.1%
2012-02-140.0%0.6%0.8%
2012-01-120.4%0.0%0.3%
2011-12-130.6%0.4%0.6%
2011-11-151.1%0.6%0.4%
2011-10-140.3%1.1%0.5%
2011-09-140.3%0.3%0.2%
2011-08-120.3%0.3%0.5%
2011-07-14-0.1%0.3%0.0%
2011-06-140.3%-0.1%-0.7%
2011-05-120.9%0.3%0.6%
2011-04-131.1%0.9%0.5%
2011-03-110.7%1.1%1.0%
2011-02-150.5%0.7%0.5%
2011-01-140.8%0.5%0.7%
2010-12-141.7%0.8%0.5%
2010-11-150.7%1.7%0.7%
2010-10-150.7%0.7%0.4%
2010-09-140.3%0.7%0.3%
2010-08-13-0.3%0.3%0.5%
2010-07-14-1.1%-0.3%-0.2%
2010-06-110.6%-1.1%0.3%
2010-05-142.1%0.6%0.3%
2010-04-140.5%2.1%1.1%
2010-03-120.1%0.5%-0.1%
2010-02-12-0.1%0.1%0.4%
2010-01-141.8%-0.1%0.4%
2009-12-111.1%1.8%0.6%
2009-11-16-2.3%1.1%1.0%
2009-10-142.2%-2.3%-2.0%
2009-09-15-0.2%2.2%1.8%
2009-08-130.8%-0.2%0.5%
2009-07-140.5%0.8%0.4%
2009-06-11-0.2%0.5%0.4%
2009-05-13-1.3%-0.2%0.0%
2009-04-14-0.1%-1.3%0.3%
2009-02-121.8%-0.1%-0.5%
2009-01-14-1.8%1.8%-1.2%
2008-12-12-2.8%-1.8%-1.9%
2008-11-14-1.2%-2.8%-2.0%
2008-10-15-0.3%-1.2%-0.6%
2008-09-12-0.1%-0.3%0.2%
2008-08-130.1%-0.1%0.0%
2008-07-151.0%0.1%0.4%
2008-06-12-0.2%1.0%0.5%
2008-05-130.2%-0.2%-0.2%
2008-04-14-0.6%0.2%0.0%
2008-03-130.3%-0.6%0.2%
2008-02-13-0.4%0.3%-0.2%
2008-01-010.80%-0.4%
2007-12-010.30%0.80%
2007-11-010.80%0.30%
2007-10-010.30%0.80%
2007-09-010.50%0.30%
2007-08-01-0.70%0.50%
2007-07-011.30%-0.70%
2007-06-01-0.40%1.30%
2007-05-011.00%-0.40%
2007-04-010.20%1.00%
2007-03-01-0.40%0.20%
2007-02-011.50%-0.40%
2007-01-010.20%1.50%
2006-12-010.00%0.20%
2006-11-01-0.40%0.00%
2006-10-010.10%-0.40%
2006-09-010.60%0.10%
2006-08-010.40%0.60%
2006-07-01-0.40%0.40%
2006-06-010.40%-0.40%
2006-05-010.50%0.40%
2006-04-01-0.90%0.50%
2006-03-013.10%-0.90%
2006-02-01-0.10%3.10%
2006-01-010.80%-0.10%
2005-12-010.40%0.80%
2005-11-010.20%0.40%
2005-10-01-1.40%0.20%
2005-09-011.00%-1.40%
2005-08-012.90%1.00%
2005-07-01-0.90%2.90%
2005-06-011.60%-0.90%
2005-05-01-0.10%1.60%
2005-04-010.80%-0.10%
2005-03-01-0.60%0.80%
2005-02-011.20%-0.60%
2005-01-010.40%1.20%
2004-12-010.60%0.40%
2004-11-011.80%0.60%
2004-10-010.10%1.80%
2004-09-011.10%0.10%
2004-08-01-1.30%1.10%
2004-07-011.70%-1.30%
2004-06-01-1.10%1.70%
2004-05-011.80%-1.10%
2004-04-010.70%1.80%
2004-03-010.60%0.70%
2004-02-01-0.40%0.60%
2004-01-011.20%-0.40%
2003-12-01-0.40%1.20%
2003-11-01-0.60%-0.40%
2003-10-011.60%-0.60%
2003-09-011.00%1.60%
2003-08-011.10%1.00%
2003-07-010.30%1.10%
2003-06-01-0.20%0.30%
2003-05-011.80%-0.20%
2003-04-01-1.40%1.80%
2003-03-010.50%-1.40%
2003-02-010.80%0.50%
2003-01-010.60%0.80%
2002-12-010.40%0.60%
2002-11-01-1.40%0.40%
2002-10-010.70%-1.40%
2002-09-011.10%0.70%
2002-08-010.80%1.10%
2002-07-01-1.30%0.80%
2002-06-011.60%-1.30%
2002-05-01-0.30%1.60%
2002-04-010.50%-0.30%
2002-03-010.00%0.50%
2002-02-01-1.10%0.00%
2002-01-01-2.60%-1.10%
2001-12-016.70%-2.60%
2001-11-01-1.90%6.70%
2001-10-010.70%-1.90%
2001-09-01-0.30%0.70%
2001-08-01-0.40%-0.30%
2001-07-010.30%-0.40%
2001-06-011.60%0.30%
2001-05-01-0.80%1.60%
2001-04-010.00%-0.80%
2001-03-011.20%0.00%
2001-02-01-0.10%1.20%
2001-01-01-0.40%-0.10%
2000-12-01-0.20%-0.40%
2000-11-011.70%-0.20%
2000-10-010.10%1.70%
2000-09-01-0.30%0.10%
13:30
Retail Sales (YoY) (Sep) 5,02%   4,26%
OpisRetail Sales measure the change in the total value of sales at the retail level. It is the foremost indicator of consumer spending, which accounts for the majority of overall economic activity. A higher than expected reading should be taken as positive/bullish for the USD, while a lower than expected reading should be taken as negative/bearish for the USD.
PriorytetNiski
DataPoprzednia wartośćKolejna wartośćPrzewidywana wartość
2025-09-164.09%5.00%
2025-08-154.35%4.09%
2025-07-173.29%4.35%
2025-06-175.00%3.29%
2025-05-155.25%5.00%
2025-04-163.54%5.25%
2025-03-174.20%3.54%
2025-02-144.36%4.20%
2025-01-164.12%4.36%
2024-12-172.90%4.12%
2024-11-151.98%2.90%
2024-10-172.16%1.98%
2024-09-172.86%2.16%
2024-08-152.04%2.86%
2024-07-162.59%2.04%
2024-06-182.74%2.59%
2024-05-153.83%2.74%
2024-04-152.11%3.83%
2024-03-140.04%2.11%
2024-02-155.31%0.04%
2024-01-173.97%5.31%
2023-12-142.24%3.97%
2023-11-154.05%2.24%
2023-10-172.89%4.05%
2023-09-142.64%2.89%
2023-08-151.59%2.64%1.50%
2023-07-181.96%1.59%1.60%
2023-06-151.23%1.96%
2023-05-162.42%1.23%4.20%
2023-04-145.88%2.42%5.90%
2023-03-157.68%5.88%
2023-02-155.89%7.68%
2023-01-186.01%5.89%
2022-12-157.51%6.01%
2022-11-168.59%7.51%
2022-10-149.44%8.59%
2022-09-1510.06%9.44%
2022-08-178.54%10.06%
2022-07-158.18%8.54%
2022-06-157.82%8.18%
2022-05-177.34%7.82%
2022-04-1418.18%7.34%
2022-03-1614.00%18.18%
2022-02-1616.71%14.00%
2022-01-1418.24%16.71%
2021-12-1516.26%18.24%
2021-11-1614.26%16.26%
2021-10-1515.40%14.26%
2021-09-1615.14%15.40%
2021-08-1718.73%15.14%
2021-07-1627.60%18.73%
2021-06-1553.40%27.60%
2021-05-1429.01%53.40%
2021-04-156.66%29.01%
2021-03-169.51%6.66%
2021-02-172.53%9.51%
2021-01-153.68%2.53%
2020-12-165.49%3.68%
2020-11-175.93%5.49%
2020-10-162.77%5.93%
2020-09-162.44%2.77%
2020-08-142.12%2.44%
2020-07-16-5.65%2.12%
2020-06-16-19.90%-5.65%
2020-05-15-5.68%-19.90%
2020-04-154.62%-5.68%
2020-03-174.96%4.62%
2020-02-145.52%4.96%
2020-01-163.33%5.52%
2019-12-133.25%3.33%
2019-11-154.07%3.25%
2019-10-164.36%4.07%
2019-09-133.45%4.36%
2019-08-153.29%3.45%
2019-07-162.90%3.29%
2019-06-143.70%2.90%
2019-05-153.80%3.70%
2019-04-182.20%3.80%
2019-04-012.80%2.20%
2019-03-111.60%2.80%
2019-02-1401.60%
13:30
Retail Sales Ex Gas/Autos (MoM) (Sep) 0,6% 0,4% 0,1%
OpisRetail sales data represents total consumer purchase from retail stores. It provides valuable information about consumer spending which makes up the consumption part of GDP. The most volatile components like autos, gas prices andfood prices are often removed from the report to show more underlying demand patterns as changes in sales in these categories are frequently a result of price changes. It is not adjusted for inflation. Spending on services is not included. Rising retail sales indicate stronger economic growth. However, if theincrease is larger than forecast, it may be inflationary.
PriorytetNiski
DataPoprzednia wartośćKolejna wartośćPrzewidywana wartość
2025-09-160.3%0.7%
2025-08-150.8%0.3%
2025-07-170.0%0.8%
2025-06-170.1%0.0%
2025-05-151.1%0.1%
2025-04-160.8%1.1%
2025-03-17-0.8%0.8%0.4%
2025-02-140.5%-0.8%
2025-01-160.2%0.5%0.4%
2024-12-170.2%0.2%0.4%
2024-11-151.2%0.2%0.3%
2024-10-170.3%1.2%
2024-09-170.4%0.3%0.3%
2024-08-150.8%0.4%
2024-07-160.3%0.8%0.2%
2024-06-18-0.3%0.3%
2024-05-150.7%-0.3%
2024-04-150.5%0.7%0.3%
2024-03-14-0.8%0.5%
2024-02-150.6%-0.8%
2024-01-170.6%0.6%
2023-12-140.1%0.6%
2023-11-150.8%0.1%0.0%
2023-10-170.3%0.8%0.1%
2023-09-140.7%0.3%0.5%
2023-08-150.4%0.7%0.1%
2023-07-180.5%0.4%0.0%
2023-06-150.5%0.5%-0.3%
2023-05-16-0.5%0.5%0.2%
2023-04-140.0%-0.5%-0.1%
2023-03-152.8%0.0%
2023-02-15-0.4%2.8%
2023-01-18-0.5%-0.4%
2022-12-150.8%-0.5%
2022-11-160.6%0.8%0.2%
2022-10-140.6%0.6%
2022-09-150.3%0.6%
2022-08-170.7%0.3%
2022-07-15-0.1%0.7%
2022-06-150.8%-0.1%
2022-05-171.2%0.8%
2022-04-14-0.1%1.2%
2022-03-165.2%-0.1%
2022-02-16-3.2%5.2%
2022-01-14-0.1%-3.2%
2021-12-151.6%-0.1%
2021-11-160.5%1.6%
2021-10-152.1%0.5%
2021-09-16-1.4%2.1%
2021-08-171.3%-1.4%
2021-07-16-1.0%1.3%
2021-06-150.1%-1.0%
2021-05-148.9%0.1%
2021-04-15-3.1%8.9%
2021-03-168.5%-3.1%
2021-02-17-2.5%8.5%
2021-01-15-1.3%-2.5%
2020-12-16-0.1%-1.3%
2020-11-171.2%-0.1%
2020-10-160.5%1.2%
2020-09-161.1%0.5%
2020-08-147.7%1.1%
2020-07-1612.1%7.7%4.2%
2020-06-16-14.4%12.1%
2020-05-15-2.6%-14.4%
2020-04-15-0.2%-2.6%
2020-03-170.7%-0.2%
2020-02-140.5%0.7%
2020-01-16-0.2%0.5%
2019-12-130.2%-0.2%
2019-11-15-0.1%0.2%0.4%
2019-10-160.4%-0.1%0.2%
2019-09-130.9%0.4%
2019-08-150.6%0.9%0.5%
2019-07-160.5%0.6%0.3%
2019-06-140.3%0.5%0.4%
2019-05-151.1%0.3%0.4%
2019-04-18-0.7%1.1%0.5%
2019-04-011.7%-0.7%0.4%
2019-03-11-1.6%1.7%0.6%
2019-02-140.5%-1.6%0.4%
2018-12-140.7%0.5%
2018-11-150.1%0.7%0.4%
2018-10-150.1%0.1%
2018-09-140.9%0.1%
2018-08-150.2%0.9%0.4%
2018-07-161.3%0.2%0.4%
2018-06-140.3%1.3%0.5%
2018-05-150.4%0.3%0.4%
2018-04-160.3%0.4%0.4%
2018-03-14-0.1%0.3%0.3%
2018-02-140.4%-0.1%0.5%
2018-01-121.2%0.4%
2017-12-140.4%1.2%0.3%
2017-11-150.6%0.4%0.3%
2017-10-130.1%0.6%0.4%
2017-09-150.5%0.1%0.5%
2017-08-150.3%0.5%0.4%
2017-07-140.0%0.3%0.4%
2017-06-140.5%0.0%0.3%
2017-05-120.4%0.5%
2017-04-140.1%0.4%0.3%
2017-03-151.1%0.1%0.2%
2017-02-150.1%1.1%0.3%
2017-01-130.3%0.1%0.4%
2016-12-140.5%0.3%
2016-11-150.5%0.5%
2016-10-14-0.1%0.5%
2016-09-15-0.1%-0.1%0.3%
2016-08-120.8%-0.1%
2016-07-150.2%0.8%
2016-06-140.6%0.2%0.2%
2016-05-130.2%0.6%
2016-04-130.6%0.2%
2016-03-15-0.1%0.6%-0.2%
2016-02-120.1%-0.1%0.3%
2016-01-150.5%0.1%0.4%
2015-12-110.3%0.5%
2015-11-130.0%0.3%0.4%
2015-10-140.2%0.0%0.3%
2015-09-150.7%0.2%
2015-08-130.2%0.7%
2015-07-140.5%0.2%
2015-06-110.2%0.5%
2015-05-130.7%0.2%
2015-04-14-0.3%0.7%0.6%
2015-03-12-0.1%-0.3%0.3%
2015-02-12-0.3%-0.1%0.4%
2015-01-140.6%-0.3%
2014-12-110.7%0.6%
2014-11-140.1%0.7%0.4%
2014-10-150.5%0.1%0.3%
2014-09-010.20%0.5%
2014-08-010.70%0.20%
2014-07-010.20%0.70%
2014-06-010.60%0.20%
2014-05-011.20%0.60%
2014-04-010.90%1.20%
2014-03-01-1.00%0.90%
2014-02-010.50%-1.00%
2014-01-010.20%0.50%
2013-12-010.30%0.20%
2013-11-010.50%0.30%
2013-10-01-0.20%0.50%
2013-09-010.70%-0.20%
2013-08-01-0.20%0.70%
2013-07-010.40%-0.20%
2013-06-01-0.10%0.40%
2013-05-01-0.10%-0.10%
2013-04-010.20%-0.10%
2013-03-010.70%0.20%
2013-02-010.70%0.70%
2013-01-010.70%0.70%
2012-12-01-0.20%0.70%
2012-11-010.60%-0.20%
2012-10-010.20%0.60%
2012-09-010.70%0.20%
2012-08-01-0.30%0.70%
2012-07-010.00%-0.30%
2012-06-01-0.60%0.00%
2012-05-010.60%-0.60%
2012-04-010.70%0.60%
2012-03-011.20%0.70%
2012-02-01-0.30%1.20%
2012-01-010.00%-0.30%
2011-12-010.80%0.00%
2011-11-010.20%0.80%
2011-10-010.40%0.20%
2011-09-01-0.10%0.40%
2011-08-010.90%-0.10%
2011-07-010.30%0.90%
2011-06-010.50%0.30%
2011-05-010.80%0.50%
2011-04-010.50%0.80%
2011-03-010.40%0.50%
2011-02-010.10%0.40%
2011-01-010.80%0.10%
2010-12-010.60%0.80%
2010-11-010.30%0.60%
2010-10-010.80%0.30%
2010-09-01-0.30%0.80%
2010-08-010.30%-0.30%
2010-07-01-0.80%0.30%
2010-06-010.60%-0.80%
2010-05-011.00%0.60%
2010-04-010.80%1.00%
2010-03-01-0.10%0.80%
2010-02-010.50%-0.10%
2010-01-010.30%0.50%
2009-12-010.00%0.30%
2009-11-010.10%0.00%
2009-10-010.10%0.10%
2009-09-01-0.10%0.10%
2009-08-010.00%-0.10%
2009-07-010.30%0.00%
2009-06-010.30%0.30%
2009-05-01-1.30%0.30%
2009-04-01-0.20%-1.30%
2009-03-010.80%-0.20%
2009-02-01-1.10%0.80%
2009-01-01-1.10%-1.10%
2008-12-01-0.90%-1.10%
2008-11-01-1.20%-0.90%
2008-10-01-0.90%-1.20%
2008-09-010.20%-0.90%
2008-08-010.40%0.20%
2008-07-010.70%0.40%
2008-06-011.10%0.70%
2008-05-010.20%1.10%
2008-04-01-0.80%0.20%
2008-03-01-0.40%-0.80%
2008-02-01-0.20%-0.40%
2008-01-011.00%-0.20%
2007-12-010.20%1.00%
2007-11-010.10%0.20%
2007-10-01-0.20%0.10%
2007-09-010.70%-0.20%
2007-08-010.00%0.70%
2007-07-010.80%0.00%
2007-06-01-0.80%0.80%
2007-05-011.00%-0.80%
2007-04-01-0.20%1.00%
2007-03-010.00%-0.20%
2007-02-011.60%0.00%
2007-01-01-0.10%1.60%
2006-12-010.50%-0.10%
2006-11-010.50%0.50%
2006-10-010.70%0.50%
2006-09-010.00%0.70%
2006-08-010.00%0.00%
2006-07-01-0.20%0.00%
2006-06-01-0.20%-0.20%
2006-05-010.40%-0.20%
2006-04-010.00%0.40%
2006-03-012.40%0.00%
2006-02-010.00%2.40%
2006-01-010.20%0.00%
2005-12-011.40%0.20%
2005-11-010.50%1.40%
2005-10-010.80%0.50%
2005-09-01-0.20%0.80%
2005-08-011.00%-0.20%
2005-07-01-0.40%1.00%
2005-06-011.60%-0.40%
2005-05-01-0.20%1.60%
2005-04-010.80%-0.20%
2005-03-010.40%0.80%
2005-02-011.00%0.40%
2005-01-010.40%1.00%
2004-12-010.70%0.40%
2004-11-010.80%0.70%
2004-10-010.20%0.80%
2004-09-010.70%0.20%
2004-08-01-0.10%0.70%
2004-07-010.50%-0.10%
2004-06-01-0.50%0.50%
2004-05-011.90%-0.50%
2004-04-010.00%1.90%
2004-03-010.80%0.00%
2004-02-010.00%0.80%
2004-01-010.50%0.00%
2003-12-010.40%0.50%
2003-11-01-0.10%0.40%
2003-10-011.10%-0.10%
2003-09-011.00%1.10%
2003-08-011.30%1.00%
2003-07-010.70%1.30%
2003-06-01-0.10%0.70%
2003-05-011.50%-0.10%
2003-04-01-0.90%1.50%
2003-03-010.50%-0.90%
2003-02-010.00%0.50%
2003-01-010.60%0.00%
2002-12-010.70%0.60%
2002-11-01-0.10%0.70%
2002-10-010.10%-0.10%
2002-09-01-0.10%0.10%
2002-08-010.20%-0.10%
2002-07-01-0.40%0.20%
2002-06-010.90%-0.40%
2002-05-010.00%0.90%
2002-04-010.50%0.00%
2002-03-010.10%0.50%
2002-02-010.60%0.10%
2002-01-010.60%0.60%
2001-12-011.70%0.60%
2001-11-01-1.70%1.70%
2001-10-010.70%-1.70%
2001-09-010.50%0.70%
2001-08-01-0.10%0.50%
2001-07-01-0.20%-0.10%
2001-06-011.10%-0.20%
2001-05-01-0.40%1.10%
2001-04-010.00%-0.40%
2001-03-010.50%0.00%
2001-02-010.40%0.50%
2001-01-010.00%0.40%
2000-12-010.00%0.00%
2000-11-011.20%0.00%
2000-10-010.30%1.20%
13:30
Wholesale Sales (MoM) (Oct) 0,6%   -0,1%
OpisWholesale Sales measures the change in the total value of sales at the wholesale level. It is a leading indicator of consumer spending.A higher than expected reading should be taken as positive/bullish for the CAD, while a lower than expected reading should be taken as negative/bearish for the CAD.
Priorytet Średni
DataPoprzednia wartośćKolejna wartośćPrzewidywana wartość
2025-11-14-1.0%0.6%0.0%
2025-10-27-1.2%-1.0%
2025-10-151.7%-1.2%-1.3%
2025-09-261.2%1.7%
2025-09-151.0%1.2%1.4%
2025-08-260.7%1.0%
2025-08-150.0%0.7%0.7%
2025-07-280.1%0.0%
2025-07-14-2.2%0.1%-0.4%
2025-06-26-2.3%-2.2%
2025-06-130.0%-2.3%-0.9%
2025-05-270.2%0.0%
2025-05-151.0%0.2%-0.4%
2025-04-280.3%1.0%
2025-04-141.4%0.3%0.4%
2025-03-261.2%1.4%
2025-03-140.3%1.2%1.9%
2025-02-26-0.2%0.3%
2025-02-140.0%-0.2%0.1%
2025-01-27-0.2%0.0%
2025-01-151.0%-0.2%-0.6%
2024-12-131.3%1.0%0.5%
2024-11-260.8%1.3%0.9%
2024-11-15-0.9%0.8%1.0%
2024-10-29-0.6%-0.9%
2024-10-150.3%-0.6%-1.1%
2024-09-260.4%0.3%
2024-09-13-0.6%0.4%-1.1%
2024-08-27-0.6%-0.6%
2024-08-15-1.2%-0.6%-0.6%
2024-07-26-0.8%-1.2%
2024-07-152.4%-0.8%2.0%
2024-06-262.4%2.4%
2024-06-14-1.3%2.4%2.6%
2024-05-27-1.1%-1.3%
2024-05-140.2%-1.1%-0.9%
2024-04-260.0%0.2%
2024-04-15-0.2%0.0%0.8%
2024-03-260.1%-0.2%
2024-03-15-0.3%0.1%-0.6%
2024-02-260.3%-0.3%
2024-02-160.9%0.3%0.7%
2024-01-260.9%0.9%
2024-01-15-0.3%0.9%0.8%
2023-12-22-0.5%-0.3%
2023-12-15-0.6%-0.5%0.5%
2023-11-230.4%-0.6%
2023-11-151.8%0.4%0.0%
2023-10-272.3%1.8%
2023-10-160.0%2.3%2.6%
2023-09-14-2.1%0.0%1.4%
2023-08-25-2.8%-2.1%
2023-08-162.9%-2.8%-4.2%
2023-07-243.5%2.9%
2023-07-17-1.4%3.5%3.5%
2023-06-26-1.4%-1.4%
2023-06-16-1.1%-1.4%1.6%
2023-05-26-0.1%-1.1%
2023-05-15-1.4%-0.1%-0.4%
2023-04-24-1.7%-1.4%0.3%
2023-04-176.1%-1.7%-1.6%
2023-03-242.4%6.1%
2023-03-16-0.7%2.4%3.0%
2023-02-24-0.8%-0.7%
2023-02-15-0.7%-0.8%-1.8%
2023-01-260.5%-0.7%
2023-01-191.9%0.5%1.9%
2022-12-222.1%1.9%
2022-12-16-0.2%2.1%1.3%
2022-11-220.1%-0.2%0.4%
2022-11-151.9%0.1%-0.2%
2022-10-211.4%1.9%
2022-10-14-0.6%1.4%0.8%
2022-09-26-0.6%-0.6%
2022-09-160.2%-0.6%-0.6%
2022-08-240.1%0.2%
2022-08-150.9%0.1%0.5%
2022-07-261.6%0.9%2.0%
2022-07-15-0.5%1.6%2.0%
2022-06-23-0.5%-0.5%
2022-06-160.6%-0.5%0.2%
2022-05-24-0.4%0.6%0.9%
2022-05-16-0.3%-0.4%-0.3%
2022-04-25-0.4%-0.3%
2022-04-143.0%-0.4%0.9%
2022-03-234.2%3.0%
2022-03-161.0%4.2%3.9%
2022-02-250.6%1.0%
2022-02-163.5%0.6%2.7%
2022-01-261.4%3.5%
2022-01-192.2%1.4%2.7%
2021-12-161.0%2.2%1.4%
2021-11-221.0%1.0%
2021-11-150.3%1.0%1.1%
2021-10-250.3%0.3%
2021-10-15-2.1%0.3%0.5%
2021-09-16-0.8%-2.1%-2.0%
2021-08-25-0.8%-0.8%
2021-08-160.5%-0.8%-2.0%
2021-07-160.6%0.5%1.1%
2021-06-240.4%0.6%
2021-06-162.8%0.4%-0.9%
2021-05-14-0.9%2.8%1.0%
2021-04-164.0%-0.9%-0.4%
2021-03-12-1.3%4.0%5.0%
2021-02-120.7%-1.3%-1.5%
2021-01-191.0%0.7%1.0%
2020-12-16-0.1%1.0%0.9%
2020-11-170.3%-0.1%0.4%
2020-10-195.2%0.3%0.3%
2020-09-1818.5%5.2%3.5%
2020-08-195.8%18.5%10.0%
2020-07-17-21.4%5.8%8.5%
2020-06-18-2.7%-21.4%-12.6%
2020-05-200.7%-2.7%-3.8%
2020-04-201.8%0.7%-0.4%
2020-03-231.0%1.8%-0.2%
2020-02-24-1.1%1.0%0.5%
2020-01-22-1.2%-1.1%-0.3%
2019-12-190.8%-1.2%-0.1%
2019-11-25-1.2%0.8%0.3%
2019-10-231.4%-1.2%0.3%
2019-09-230.7%1.4%-0.1%
2019-08-22-1.9%0.7%-0.2%
2019-07-221.6%-1.9%0.5%
2019-06-251.4%1.6%0.2%
2019-05-230.2%1.4%0.9%
2019-04-230.4%0.2%0.1%
2019-03-210.3%0.4%0.5%
2019-02-21-1.1%0.3%-0.1%
2019-01-220.7%-1.1%0.1%
2018-12-20-0.7%0.7%0.2%
2018-11-21-0.1%-0.7%0.1%
2018-10-221.1%-0.1%0.1%
2018-09-24-0.8%1.1%0.4%
2018-08-210.9%-0.8%0.8%
2018-07-23-0.1%0.9%0.6%
2018-06-211.4%-0.1%0.4%
2018-05-22-0.4%1.4%0.8%
2018-04-230.3%-0.4%0.3%
2018-03-20-0.2%0.3%0.1%
2018-02-200.3%-0.2%0.4%
2018-01-221.6%0.3%1.0%
2017-12-20-1.1%1.6%0.5%
2017-11-210.4%-1.1%0.3%
2017-10-231.7%0.4%0.6%
2017-09-21-0.6%1.7%-0.9%
2017-08-211.0%-0.6%-0.4%
2017-07-240.8%1.0%0.5%
2017-06-201.2%0.8%0.5%
2017-05-230.3%1.2%0.9%
2017-04-243.0%0.3%-1.0%
2017-03-200.3%3.0%0.4%
2017-02-200.1%0.3%0.4%
2017-01-231.3%0.1%0.5%
2016-12-20-1.5%1.3%0.6%
2016-11-210.8%-1.5%0.4%
2016-10-240.1%0.8%0.6%
2016-09-210.7%0.1%0.2%
2016-08-221.9%0.7%0.5%
2016-07-210.2%1.9%0.2%
2016-06-20-0.8%0.2%0.5%
2016-05-19-2.3%-0.8%-0.5%
2016-04-200.2%-2.3%-0.3%
2016-03-171.8%0.2%0.2%
2016-02-181.9%1.8%0.2%
2016-01-20-0.5%1.9%0.5%
2015-12-18-0.3%-0.5%0.1%
2015-11-19-0.1%-0.3%0.3%
2015-10-20-0.1%-0.1%0.2%
2015-09-211.3%-0.1%0.8%
2015-08-20-0.9%1.3%1.0%
2015-07-201.7%-0.9%0.1%
2015-06-171.0%1.7%0.3%
2015-05-20-0.4%1.0%0.9%
2015-04-21-2.9%-0.4%0.5%
2015-03-182.8%-2.9%-1.0%
2015-02-18-0.3%2.8%0.4%
2015-01-210.1%-0.3%0.2%
2014-12-171.8%0.1%0.9%
2014-11-200.0%1.8%0.7%
2014-10-20-0.2%0.0%0.2%
2014-09-190.8%-0.2%0.8%
2014-08-202.3%0.8%1.3%
2014-07-181.4%2.3%0.7%
2014-06-18-0.3%1.4%0.3%
2014-05-201.1%-0.3%0.5%
2014-04-220.5%1.1%0.7%
2014-03-19-1.3%0.5%1.2%
2014-02-19-0.2%-1.3%-0.5%
2014-01-211.2%-0.2%0.4%
2013-12-180.0%1.2%0.4%
2013-11-200.4%0.0%1.0%
2013-10-211.7%0.4%0.7%
2013-09-19-3.1%1.7%1.0%
2013-08-202.2%-3.1%-1.0%
2013-07-180.4%2.2%0.4%
2013-06-190.1%0.4%1.0%
2013-05-170.1%0.1%0.4%
2013-04-190.5%0.1%1.0%
2013-03-19-1.1%0.5%0.4%
2013-02-190.7%-1.1%-1.0%
2013-01-210.8%0.7%1.0%
2012-12-19-1.5%0.8%1.0%
2012-11-200.3%-1.5%0.3%
2012-10-18-0.7%0.3%0.2%
2012-09-21-0.3%-0.7%-0.1%
2012-08-210.9%-0.3%0.4%
2012-07-191.2%0.9%0.2%
2012-06-190.3%1.2%1.0%
2012-05-171.5%0.3%0.4%
2012-04-23-1.1%1.5%-1.0%
2012-03-191.0%-1.1%0.4%
2012-02-21-0.3%1.0%0.5%
2012-01-200.9%-0.3%1.0%
2011-12-190.5%0.9%0.6%
2011-11-210.3%0.5%0.5%
2011-10-200.9%0.3%0.4%
2011-09-200.0%0.9%0.4%
2011-08-182.0%0.0%1.5%
2011-07-20-0.1%2.0%0.3%
2011-06-170.3%-0.1%-0.3%
2011-05-18-0.9%0.3%1.2%
2011-04-191.6%-0.9%0.3%
2011-03-170.9%1.6%1.1%
2011-02-171.0%0.9%1.9%
2011-01-200.3%1.0%0.4%
2010-12-200.7%0.3%0.7%
2010-11-181.3%0.7%0.1%
2010-10-200.0%1.3%0.5%
2010-09-20-0.3%0.0%0.6%
2010-08-190.0%-0.3%0.4%
2010-07-21-0.2%0.0%0.3%
2010-06-171.2%-0.2%0.4%
2010-05-19-1.5%1.2%0.3%
2010-04-212.4%-1.5%1.3%
2010-03-170.9%2.4%0.7%
2010-02-172.7%0.9%0.6%
2010-01-210.5%2.7%0.4%
2009-12-180.1%0.5%0.2%
2009-11-19-1.5%0.1%-0.3%
2009-10-202.6%-1.5%0.7%
2009-09-180.8%2.6%0.7%
2009-08-20-0.2%0.8%-0.1%
2009-07-20-0.7%-0.2%-2.5%
2009-06-17-0.4%-0.7%-0.9%
2009-05-21-0.9%-0.4%-0.8%
2009-04-21-4.2%-0.9%1.3%
2009-03-18-3.4%-4.2%-2.6%
2009-01-21-1.8%-3.4%-1.6%
2008-12-171.5%-1.8%-0.5%
2008-11-20-1.5%1.5%-0.5%
2008-10-202.3%-1.5%-0.8%
2008-09-182.0%2.3%0.6%
2008-08-191.6%2.0%0.7%
2008-07-181.4%1.6%0.5%
2008-06-190.6%1.4%0.8%
2008-05-20-1.8%0.6%0.2%
2008-04-182.6%-1.8%0.5%
2008-03-19-2.9%2.6%1.0%
2008-02-190.2%-2.9%-0.6%
2008-01-010.00%0.2%
2007-12-010.80%0.00%
2007-11-010.20%0.80%
2007-10-010.10%0.20%
2007-09-01-0.70%0.10%
2007-08-01-0.10%-0.70%
2007-07-010.20%-0.10%
2007-06-01-1.30%0.20%
2007-05-011.10%-1.30%
2007-04-012.70%1.10%
2007-03-01-1.70%2.70%
2007-02-014.70%-1.70%
2007-01-011.00%4.70%
2006-12-01-0.50%1.00%
2006-11-01-1.20%-0.50%
2006-10-011.10%-1.20%
2006-09-010.40%1.10%
2006-08-01-1.20%0.40%
2006-07-010.70%-1.20%
2006-06-011.10%0.70%
2006-05-01-0.10%1.10%
2006-04-01-0.30%-0.10%
2006-03-011.00%-0.30%
2006-02-01-0.30%1.00%
2006-01-01-0.50%-0.30%
2005-12-011.90%-0.50%
2005-11-011.80%1.90%
2005-10-013.40%1.80%
2005-09-01-3.90%3.40%
2005-08-011.70%-3.90%
2005-07-010.60%1.70%
2005-06-011.00%0.60%
2005-05-01-1.50%1.00%
2005-04-011.30%-1.50%
2005-03-010.20%1.30%
2005-02-01-0.10%0.20%
2005-01-011.40%-0.10%
2004-12-01-0.40%1.40%
2004-11-010.20%-0.40%
13:55
Redbook (YoY) 6,1%   5,9%
OpisThe Redbook Index is a sales-weighted of year-over-year same-store sales growth in a sample of large US general merchandise retailers representing about 9,000 stores. A higher than expected number should be taken as positive to the USD, while a lower than expected number as negative.
PriorytetNiski
DataPoprzednia wartośćKolejna wartośćPrzewidywana wartość
2025-11-185.9%6.1%
2025-11-115.7%5.9%
2025-11-045.2%5.7%
2025-10-285.0%5.2%
2025-10-215.9%5.0%
2025-10-145.8%5.9%
2025-10-075.9%5.8%
2025-09-305.7%5.9%
2025-09-236.3%5.7%
2025-09-166.6%6.3%
2025-09-096.5%6.6%
2025-09-036.5%6.5%
2025-08-265.9%6.5%
2025-08-195.7%5.9%
2025-08-126.5%5.7%
2025-08-054.9%6.5%
2025-07-295.1%4.9%
2025-07-225.2%5.1%
2025-07-155.9%5.2%
2025-07-084.9%5.9%
2025-07-014.5%4.9%
2025-06-245.2%4.5%
2025-06-174.7%5.2%
2025-06-104.9%4.7%
2025-06-036.1%4.9%
2025-05-285.4%6.1%
2025-05-205.8%5.4%
2025-05-136.9%5.8%
2025-05-066.1%6.9%
2025-04-297.4%6.1%
2025-04-226.6%7.4%
2025-04-157.2%6.6%
2025-04-084.8%7.2%
2025-04-015.6%4.8%
2025-03-255.2%5.6%
2025-03-185.7%5.2%
2025-03-116.6%5.7%
2025-03-046.2%6.6%
2025-02-256.3%6.2%
2025-02-195.3%6.3%
2025-02-115.7%5.3%
2025-02-044.9%5.7%
2025-01-284.5%4.9%
2025-01-224.0%4.5%
2025-01-146.8%4.0%
2025-01-077.1%6.8%
2024-12-315.9%7.1%
2024-12-244.8%5.9%
2024-12-174.2%4.8%
2024-12-107.4%4.2%
2024-12-034.9%7.4%
2024-11-265.1%4.9%
2024-11-194.8%5.1%
2024-11-126.0%4.8%
2024-11-055.6%6.0%
2024-10-294.6%5.6%
2024-10-225.6%4.6%
2024-10-155.4%5.6%
2024-10-085.3%5.4%
2024-10-014.4%5.3%
2024-09-244.6%4.4%
2024-09-176.5%4.6%
2024-09-106.3%6.5%
2024-09-045.0%6.3%
2024-09-045.0%5.0%
2024-08-274.9%5.0%
2024-08-204.7%4.9%
2024-08-135.1%4.7%
2024-08-064.5%5.1%
2024-07-304.9%4.5%
2024-07-234.8%4.9%
2024-07-166.3%4.8%
2024-07-095.8%6.3%
2024-07-025.3%5.8%
2024-06-255.9%5.3%
2024-06-185.5%5.9%
2024-06-115.8%5.5%
2024-06-046.3%5.8%
2024-05-295.5%6.3%
2024-05-216.3%5.5%
2024-05-146.0%6.3%
2024-05-075.5%6.0%
2024-04-305.3%5.5%
2024-04-234.9%5.3%
2024-04-165.4%4.9%
2024-04-095.2%5.4%
2024-04-023.9%5.2%
2024-03-263.4%3.9%
2024-03-193.0%3.4%
2024-03-123.1%3.0%
2024-03-052.7%3.1%
2024-02-273.0%2.7%
2024-02-212.5%3.0%
2024-02-136.1%2.5%
2024-02-065.0%6.1%
2024-01-305.2%5.0%
2024-01-235.0%5.2%
2024-01-175.9%5.0%
2024-01-095.6%5.9%
2024-01-034.1%5.6%
2023-12-273.6%4.1%
2023-12-193.4%3.6%
2023-12-123.0%3.4%
2023-12-056.3%3.0%
2023-11-283.4%6.3%
2023-11-213.0%3.4%
2023-11-143.1%3.0%
2023-11-075.3%3.1%
2023-10-315.0%5.3%
2023-10-244.6%5.0%
2023-10-174.0%4.6%
2023-10-103.5%4.0%
2023-10-033.8%3.5%
2023-09-263.6%3.8%
2023-09-194.6%3.6%
2023-09-124.1%4.6%
2023-09-064.2%4.1%
2023-08-292.9%4.2%
2023-08-220.7%2.9%
2023-08-150.3%0.7%
2023-08-080.1%0.3%
2023-08-01-0.4%0.1%
2023-07-25-0.2%-0.4%
2023-07-18-0.4%-0.2%
2023-07-110.7%-0.4%
2023-07-050.5%0.7%
2023-06-270.9%0.5%
2023-06-210.4%0.9%
2023-06-130.6%0.4%
2023-06-061.2%0.6%
2023-05-311.5%1.2%
2023-05-231.6%1.5%
2023-05-161.3%1.6%
2023-05-091.3%1.3%
2023-05-021.8%1.3%
2023-04-251.1%1.8%
2023-04-181.5%1.1%
2023-04-113.7%1.5%
2023-04-042.8%3.7%
2023-03-283.2%2.8%
2023-03-212.6%3.2%
2023-03-143.0%2.6%
2023-03-075.3%3.0%
2023-02-285.3%5.3%
2023-02-224.9%5.3%
2023-02-144.3%4.9%
2023-02-074.9%4.3%
2023-01-314.6%4.9%
2023-01-245.0%4.6%
2023-01-185.3%5.0%
2023-01-1010.2%5.3%
2023-01-049.6%10.2%
2022-12-287.6%9.6%
2022-12-205.9%7.6%
2022-12-135.7%5.9%
2022-12-0610.4%5.7%
2022-11-297.5%10.4%
2022-11-226.8%7.5%
2022-11-157.6%6.8%
2022-11-089.7%7.6%
2022-11-018.2%9.7%
2022-10-258.0%8.2%
2022-10-188.3%8.0%
2022-10-1112.3%8.3%
2022-10-0411.0%12.3%
2022-09-2710.5%11.0%
2022-09-2011.4%10.5%
2022-09-1310.9%11.4%
2022-09-0714.2%10.9%
2022-08-3013.5%14.2%
2022-08-2312.7%13.5%
2022-08-1610.4%12.7%
2022-08-0915.5%10.4%
2022-08-0213.3%15.5%
2022-07-2614.6%13.3%
2022-07-1913.0%14.6%
2022-07-1213.1%13.0%
2022-07-0611.7%13.1%
2022-06-2812.8%11.7%
2022-06-2211.4%12.8%
2022-06-1412.4%11.4%
2022-06-0712.6%12.4%
2022-06-0111.4%12.6%
2022-05-2412.7%11.4%
2022-05-1713.1%12.7%
2022-05-1015.2%13.1%
2022-05-0312.7%15.2%
2022-04-2615.2%12.7%
2022-04-1913.4%15.2%
2022-04-1214.3%13.4%
2022-04-0512.9%14.3%
2022-03-2912.4%12.9%
2022-03-2212.6%12.4%
2022-03-1513.1%12.6%
2022-03-0813.4%13.1%
2022-03-0114.5%13.4%
2022-02-2315.4%14.5%
2022-02-1513.3%15.4%
2022-02-0815.8%13.3%
2022-02-0115.6%15.8%
2022-01-2515.2%15.6%
2022-01-1914.4%15.2%
2022-01-1118.8%14.4%
2022-01-0421.4%18.8%
2021-12-2816.4%21.4%
2021-12-2116.0%16.4%
2021-12-1415.3%16.0%
2021-12-0721.9%15.3%
2021-11-3015.4%21.9%
2021-11-2314.7%15.4%
2021-11-1615.6%14.7%
2021-11-0916.9%15.6%
2021-11-0215.6%16.9%
2021-10-2615.4%15.6%
2021-10-1914.8%15.4%
2021-10-1216.6%14.8%
2021-10-0516.5%16.6%
2021-09-2817.1%16.5%
2021-09-2115.3%17.1%
2021-09-1416.5%15.3%
2021-09-0818.6%16.5%
2021-08-3116.6%18.6%
2021-08-2415.0%16.6%
2021-08-1716.2%15.0%
2021-08-1017.2%16.2%
2021-08-0316.0%17.2%
2021-07-2715.0%16.0%
2021-07-2014.0%15.0%
2021-07-1319.4%14.0%
2021-07-0718.2%19.4%
2021-06-2917.6%18.2%
2021-06-2216.4%17.6%
2021-06-1514.5%16.4%
2021-06-0813.0%14.5%
2021-06-0213.6%13.0%
2021-05-2512.6%13.6%
2021-05-1813.3%12.6%
2021-05-1114.2%13.3%
2021-05-0413.9%14.2%
2021-04-2713.5%13.9%
2021-04-2013.2%13.5%
2021-04-1310.6%13.2%
2021-04-069.8%10.6%
2021-03-309.4%9.8%
2021-03-238.5%9.4%
2021-03-168.0%8.5%
2021-03-094.6%8.0%
2021-03-022.9%4.6%
2021-02-234.0%2.9%
2021-02-170.7%4.0%
2021-02-094.4%0.7%
2021-02-023.9%4.4%
2021-01-262.2%3.9%
2021-01-202.1%2.2%
2021-01-125.5%2.1%
2021-01-058.9%5.5%
2020-12-296.5%8.9%
2020-12-222.5%6.5%
2020-12-152.1%2.5%
2020-12-089.2%2.1%
2020-12-012.8%9.2%
2020-11-241.7%2.8%
2020-11-171.1%1.7%
2020-11-103.2%1.1%
2020-11-031.2%3.2%
2020-10-272.5%1.2%
2020-10-201.2%2.5%
2020-10-132.1%1.2%
2020-10-062.2%2.1%
2020-09-291.5%2.2%
2020-09-22-1.2%1.5%
2020-09-15-0.1%-1.2%
2020-09-094.6%-0.1%
2020-09-010.6%4.6%
2020-08-25-2.8%0.6%
2020-08-18-3.4%-2.8%
2020-08-11-7.1%-3.4%
2020-08-04-8.7%-7.1%
2020-07-28-7.5%-8.7%
2020-07-21-5.5%-7.5%
2020-07-14-6.9%-5.5%
2020-07-07-5.7%-6.9%
2020-06-30-6.1%-5.7%
2020-06-23-8.3%-6.1%
2020-06-16-9.7%-8.3%
2020-06-09-7.2%-9.7%
2020-06-02-5.5%-7.2%
2020-05-27-9.5%-5.5%
2020-05-19-7.5%-9.5%
2020-05-12-9.3%-7.5%
2020-05-05-8.1%-9.3%
2020-04-28-6.9%-8.1%
2020-04-21-2.0%-6.9%
2020-04-145.3%-2.0%
2020-04-076.3%5.3%
2020-03-319.1%6.3%
2020-03-248.5%9.1%
2020-03-176.0%8.5%
2020-03-105.9%6.0%
2020-03-035.4%5.9%
14:00
House Price Index (MoM) (Sep) 0,4%   0,0%
OpisThe House Price Index (HPI) is a broad measure of the movement of single-family house prices, with mortgages backed by Fannie Mae or Freddie Mac. This report helps to analyze the strength of the US housing market, which helps to analysis the economy as a whole.A higher than expected reading should be taken as positive/bullish for the USD, while a lower than expected reading should be taken as negative/bearish for the USD.
PriorytetNiski
DataPoprzednia wartośćKolejna wartośćPrzewidywana wartość
2025-10-280.0%0.4%-0.1%
2025-09-30-0.2%0.0%-0.2%
2025-08-26-0.1%-0.2%-0.1%
2025-07-29-0.3%-0.1%-0.1%
2025-06-240.0%-0.3%0.1%
2025-05-270.0%0.0%0.1%
2025-04-290.3%0.0%0.3%
2025-03-250.5%0.3%0.2%
2025-02-250.4%0.5%0.2%
2025-01-280.5%0.4%0.4%
2024-12-310.7%0.5%0.5%
2024-11-260.4%0.7%0.3%
2024-10-290.2%0.4%0.1%
2024-09-240.0%0.2%0.2%
2024-08-270.0%0.0%0.1%
2024-07-300.3%0.0%0.2%
2024-06-250.1%0.3%0.3%
2024-05-281.2%0.1%0.5%
2024-04-30-0.1%1.2%0.1%
2024-03-260.1%-0.1%0.2%
2024-02-270.4%0.1%0.3%
2024-01-300.3%0.4%0.2%
2023-12-260.7%0.3%0.5%
2023-11-280.7%0.7%0.4%
2023-10-310.8%0.7%0.5%
2023-09-260.4%0.8%0.5%
2023-08-290.7%0.4%0.2%
2023-07-250.7%0.7%0.2%
2023-06-270.5%0.7%0.3%
2023-05-300.7%0.5%0.2%
2023-04-250.1%0.7%-0.1%
2023-03-28-0.1%0.1%-0.2%
2023-02-28-0.1%-0.1%-0.2%
2023-01-310.0%-0.1%-0.4%
2022-12-270.1%0.0%-0.6%
2022-11-29-0.7%0.1%-1.2%
2022-10-25-0.6%-0.7%
2022-09-270.1%-0.6%
2022-08-301.3%0.1%0.8%
2022-07-261.5%1.3%
2022-06-281.6%1.5%
2022-05-311.9%1.6%
2022-04-261.6%1.9%
2022-03-291.3%1.6%
2022-02-221.2%1.3%
2022-01-251.1%1.2%1.1%
2021-12-280.9%1.1%0.9%
2021-11-301.0%0.9%
2021-10-261.4%1.0%
2021-09-281.7%1.4%
2021-08-311.8%1.7%
2021-07-271.8%1.8%
2021-06-291.6%1.8%
2021-05-251.1%1.6%
2021-04-271.0%1.1%
2021-03-301.2%1.0%
2021-02-231.0%1.2%
2021-01-261.5%1.0%
2020-12-231.7%1.5%
2020-11-241.5%1.7%
2020-10-271.1%1.5%
2020-09-231.0%1.1%
2020-08-25-0.2%1.0%
2020-07-220.1%-0.2%
2020-06-240.1%0.1%
2020-05-260.8%0.1%
2020-04-220.5%0.8%
2020-03-250.6%0.5%
2020-02-250.3%0.6%0.3%
2020-01-220.2%0.3%0.2%
2019-12-310.6%0.2%
2019-11-260.2%0.6%0.5%
2019-10-230.4%0.2%0.4%
2019-09-240.2%0.4%0.3%
2019-08-270.2%0.2%0.2%
2019-07-230.4%0.2%0.3%
2019-06-250.1%0.4%0.2%
2019-05-280.4%0.1%0.2%
2019-04-230.6%0.4%0.6%
2019-03-260.3%0.6%0.4%
2019-02-260.4%0.3%0.3%
2019-01-230.4%0.4%0.2%
2018-12-270.2%0.4%0.3%
2018-11-270.4%0.2%0.4%
2018-10-240.4%0.4%0.3%
2018-09-250.3%0.4%0.2%
2018-08-230.4%0.3%0.3%
2018-07-240.2%0.4%0.4%
2018-06-210.2%0.2%0.3%
2018-05-240.8%0.2%0.5%
2018-04-240.9%0.8%0.5%
2018-03-220.4%0.9%0.4%
2018-02-270.5%0.4%0.4%
2018-01-240.6%0.5%0.4%
2017-12-210.5%0.6%0.2%
2017-11-280.8%0.5%0.6%
2017-10-250.4%0.8%0.4%
2017-09-210.1%0.4%0.4%
2017-08-220.3%0.1%0.4%
2017-07-250.6%0.3%0.6%
2017-06-220.7%0.6%0.4%
2017-05-240.8%0.7%0.6%
2017-04-250.2%0.8%0.3%
2017-03-220.4%0.2%0.4%
2017-02-230.7%0.4%0.4%
2017-01-250.3%0.7%0.4%
2016-12-220.6%0.3%0.4%
2016-11-230.7%0.6%0.5%
2016-10-250.5%0.7%0.5%
2016-09-220.3%0.5%0.3%
2016-08-240.2%0.3%0.3%
2016-07-210.3%0.2%0.4%
2016-06-220.8%0.3%0.6%
2016-05-250.5%0.8%0.4%
2016-04-210.4%0.5%
2016-03-220.5%0.4%0.5%
2016-02-250.6%0.5%0.5%
2016-01-260.5%0.6%0.4%
2015-12-220.7%0.5%0.4%
2015-11-250.3%0.7%0.5%
2015-10-220.5%0.3%0.4%
2015-09-220.2%0.5%0.4%
2015-08-250.5%0.2%0.4%
2015-07-220.4%0.5%0.5%
2015-06-230.3%0.4%0.6%
2015-05-260.6%0.3%0.7%
2015-04-220.3%0.6%0.7%
2015-03-240.7%0.3%0.5%
2015-02-260.7%0.7%0.5%
2015-01-220.4%0.7%0.4%
2014-12-230.0%0.4%0.3%
2014-11-250.4%0.0%0.5%
2014-10-230.2%0.4%0.4%
2014-09-230.3%0.2%0.4%
2014-08-260.2%0.3%0.3%
2014-07-220.0%0.2%0.4%
2014-06-240.7%0.0%0.6%
2014-05-270.6%0.7%0.5%
2014-04-220.4%0.6%0.6%
2014-03-250.7%0.4%0.7%
2014-02-25-0.1%0.7%0.4%
2014-01-230.5%-0.1%0.4%
2013-12-240.2%0.5%0.5%
2013-11-260.4%0.2%0.5%
2013-10-230.8%0.4%0.8%
2013-09-240.7%0.8%0.9%
2013-08-220.8%0.7%0.6%
2013-07-230.5%0.8%0.9%
2013-06-251.5%0.5%1.2%
2013-05-230.9%1.5%0.9%
2013-04-230.6%0.9%0.7%
2013-03-210.5%0.6%0.7%
2013-02-260.4%0.5%0.6%
2013-01-230.6%0.4%0.6%
2012-12-200.0%0.6%0.2%
2012-11-270.5%0.0%0.4%
2012-10-240.1%0.5%0.4%
2012-09-250.6%0.1%0.7%
2012-08-230.6%0.6%0.6%
2012-07-240.7%0.6%0.5%
2012-06-211.6%0.7%0.5%
2012-05-230.3%1.6%0.4%
2012-04-24-0.5%0.3%0.1%
2012-03-220.1%-0.5%0.2%
2012-02-230.7%0.1%0.4%
2012-01-25-0.7%0.7%0.2%
2011-12-220.4%-0.7%0.2%
2011-11-29-0.2%0.4%0.1%
2011-10-250.0%-0.2%0.2%
2011-09-220.7%0.0%0.1%
2011-08-240.4%0.7%0.1%
2011-07-210.8%0.4%0.4%
2011-06-22-0.4%0.8%-0.2%
2011-05-25-1.5%-0.4%-0.5%
2011-04-21-1.0%-1.5%-0.2%
2011-03-22-1.0%-1.0%-0.2%
2011-02-24-0.3%-1.0%-0.2%
2011-01-250.2%-0.3%-0.1%
2010-12-22-1.2%0.2%-0.1%
2010-11-240.0%-1.2%-0.1%
2010-10-26-0.7%0.0%-0.2%
2010-09-22-1.2%-0.7%-0.1%
2010-08-250.5%-1.2%0.1%
2010-07-220.9%0.5%-0.3%
2010-06-220.1%0.9%0.2%
2010-05-25-0.4%0.1%0.0%
2010-04-22-0.6%-0.4%-0.1%
2010-03-23-2.0%-0.6%-1.0%
2010-02-250.4%-2.0%0.6%
2010-01-260.4%0.4%0.5%
2009-12-220.4%0.4%0.2%
2009-11-24-0.5%0.4%0.2%
2009-10-220.3%-0.5%0.3%
2009-09-220.1%0.3%0.5%
2009-08-250.6%0.1%0.4%
2009-07-22-0.3%0.6%-0.2%
2009-06-23-1.4%-0.3%-0.3%
2009-05-270.2%-1.4%0.2%
2009-04-221.0%0.2%-0.7%
2009-03-24-0.2%1.0%-0.7%
2009-02-24-1.8%-0.2%-1.8%
2009-01-22-1.1%-1.8%-1.2%
2008-12-23-1.3%-1.1%-1.3%
2008-11-25-0.6%-1.3%-0.7%
2008-10-23-0.6%-0.6%-0.5%
2008-09-230.0%-0.6%-0.3%
2008-08-26-0.3%0.0%-0.4%
2008-07-22-0.8%-0.3%-0.6%
2008-06-01-1.10%-0.8%
2008-05-01-0.90%-1.10%
2008-04-01-0.50%-0.90%
2008-03-01-0.90%-0.50%
2008-02-01-0.50%-0.90%
2008-01-01-0.60%-0.50%
2007-12-01-0.80%-0.60%
2007-11-01-0.40%-0.80%
2007-10-01-0.40%-0.40%
2007-09-01-0.50%-0.40%
2007-08-01-0.40%-0.50%
2007-07-01-0.50%-0.40%
2007-06-010.00%-0.50%
2007-05-010.50%0.00%
2007-04-01-0.10%0.50%
2007-03-010.40%-0.10%
2007-02-010.10%0.40%
2007-01-010.30%0.10%
2006-12-010.10%0.30%
2006-11-010.00%0.10%
2006-10-010.30%0.00%
2006-09-010.00%0.30%
2006-08-010.00%0.00%
2006-07-010.30%0.00%
2006-06-010.20%0.30%
2006-05-010.40%0.20%
2006-04-010.20%0.40%
2006-03-010.70%0.20%
2006-02-010.60%0.70%
2006-01-010.60%0.60%
2005-12-010.60%0.60%
2005-11-010.90%0.60%
2005-10-010.80%0.90%
2005-09-011.00%0.80%
2005-08-010.90%1.00%
2005-07-010.80%0.90%
2005-06-010.90%0.80%
2005-05-011.00%0.90%
2005-04-010.70%1.00%
2005-03-010.70%0.70%
2005-02-010.80%0.70%
2005-01-010.90%0.80%
2004-12-010.70%0.90%
2004-11-010.80%0.70%
2004-10-010.70%0.80%
2004-09-010.80%0.70%
2004-08-011.00%0.80%
2004-07-011.00%1.00%
2004-06-010.80%1.00%
2004-05-010.70%0.80%
2004-04-010.80%0.70%
2004-03-010.70%0.80%
2004-02-010.80%0.70%
2004-01-010.80%0.80%
2003-12-010.60%0.80%
2003-11-010.80%0.60%
2003-10-010.80%0.80%
2003-09-010.80%0.80%
2003-08-010.50%0.80%
2003-07-010.50%0.50%
2003-06-010.60%0.50%
2003-05-010.40%0.60%
2003-04-010.60%0.40%
2003-03-010.60%0.60%
2003-02-010.70%0.60%
2003-01-010.60%0.70%
2002-12-010.70%0.60%
2002-11-010.60%0.70%
2002-10-010.70%0.60%
2002-09-010.60%0.70%
2002-08-010.60%0.60%
2002-07-010.70%0.60%
2002-06-010.60%0.70%
2002-05-010.60%0.60%
2002-04-010.60%0.60%
2002-03-010.60%0.60%
2002-02-010.60%0.60%
2002-01-010.30%0.60%
2001-12-010.60%0.30%
2001-11-010.50%0.60%
2001-10-010.50%0.50%
2001-09-010.60%0.50%
2001-08-010.50%0.60%
2001-07-010.40%0.50%
2001-06-010.60%0.40%
2001-05-010.60%0.60%
2001-04-010.70%0.60%
2001-03-010.70%0.70%
2001-02-010.60%0.70%
2001-01-010.60%0.60%
2000-12-010.60%0.60%
2000-11-010.60%0.60%
14:00
House Price Index (YoY) (Sep) 2,4%   1,7%
OpisThe HPI is published by OFHEO using data provided by Fannie Mae and Freddie Mac. House price index is a statistic designed to reflect the average change of house prices across the country or a certain area. A higher than expected number should be taken as positive to the USD, while a lower than expected number as negative
PriorytetNiski
DataPoprzednia wartośćKolejna wartośćPrzewidywana wartość
2025-10-282.4%2.3%
2025-09-302.7%2.4%
2025-08-262.9%2.7%
2025-07-293.2%2.9%
2025-06-243.9%3.2%
2025-05-273.9%3.9%
2025-04-295.0%3.9%
2025-03-254.8%5.0%
2025-02-254.5%4.8%
2025-01-284.5%4.5%
2024-12-314.5%4.5%
2024-11-264.4%4.5%
2024-10-294.7%4.4%
2024-09-245.3%4.7%
2024-08-275.9%5.3%
2024-07-306.5%5.9%
2024-06-256.7%6.5%
2024-05-287.1%6.7%
2024-04-306.5%7.1%
2024-03-266.7%6.5%
2024-02-276.7%6.7%
2024-01-306.3%6.7%
2023-12-266.2%6.3%
2023-11-285.8%6.2%
2023-10-314.6%5.8%
2023-09-263.2%4.6%
2023-08-292.9%3.2%
2023-07-253.1%2.9%2.6%
2023-06-273.7%3.1%3.1%
2023-05-304.2%3.7%2.4%
2023-04-255.3%4.2%3.9%
2023-03-286.7%5.3%
2023-02-288.2%6.7%
2023-01-319.8%8.2%
2022-12-2711.1%9.8%
2022-11-2912.0%11.1%
2022-10-2513.9%12.0%
2022-09-2716.3%13.9%
2022-08-3018.3%16.3%
2022-07-2618.9%18.3%
2022-06-2819.1%18.9%
2022-05-3119.3%19.1%
2022-04-2618.3%19.3%
2022-03-2917.7%18.3%
2022-02-2217.6%17.7%
2022-01-2517.4%17.6%
2021-12-2817.7%17.4%
2021-11-3018.5%17.7%
2021-10-2619.2%18.5%
2021-09-2818.9%19.2%
2021-08-3118.2%18.9%
2021-07-2715.8%18.2%
2021-06-2914.0%15.8%
2021-05-2512.4%14.0%
2021-04-2712.1%12.4%
2021-03-3011.4%12.1%
2021-02-2311.1%11.4%
2021-01-2610.3%11.1%
2020-12-239.1%10.3%
2020-11-248.1%9.1%
2020-10-276.5%8.1%
2020-09-235.8%6.5%
2020-08-254.9%5.8%
2020-07-225.5%4.9%
2020-06-245.9%5.5%
2020-05-266.0%5.9%
2020-04-225.4%6.0%
2020-03-255.2%5.4%
2020-02-255.0%5.2%
2020-01-225.0%5.0%
2019-12-315.1%5.0%
2019-11-264.6%5.1%
2019-10-235.0%4.6%
2019-09-244.8%5.0%
2019-08-275.2%4.8%
2019-07-235.3%5.2%
2019-06-254.9%5.3%
2019-05-285.1%4.9%
2019-04-235.6%5.1%
2019-03-265.6%5.6%
2019-02-265.8%5.6%
2019-01-235.7%5.8%
2018-12-276.0%5.7%
2018-11-276.1%6.0%
2018-10-246.6%6.1%
2018-09-256.5%6.6%
2018-08-236.4%6.5%
2018-07-246.4%6.4%
2018-06-216.7%6.4%
2018-05-247.2%6.7%
2018-04-247.3%7.2%
2018-03-226.5%7.3%
2018-02-276.7%6.5%
2018-01-246.6%6.7%
2017-12-216.3%6.6%
2017-11-286.6%6.3%
2017-10-256.3%6.6%
2017-09-216.5%6.3%
2017-08-226.9%6.5%
2017-07-256.8%6.9%
2017-06-226.2%6.8%
2017-05-246.4%6.2%
2017-04-255.7%6.4%
2017-03-226.2%5.7%
2017-02-236.1%6.2%
2017-01-256.2%6.1%
2016-12-226.2%6.2%
2016-11-236.4%6.2%
2016-10-255.8%6.4%
2016-09-225.6%5.8%
2016-08-245.6%5.6%
2016-07-215.9%5.6%
2016-06-226.1%5.9%
2016-05-255.6%6.1%
2016-04-216.0%5.6%
2016-03-225.7%6.0%
2016-02-255.9%5.7%
2016-01-266.1%5.9%
2015-12-226.1%6.1%
2015-11-255.5%6.1%
2015-10-225.8%5.5%
2015-09-225.6%5.8%
2015-08-255.7%5.6%
2015-07-225.3%5.7%
2015-06-235.2%5.3%
2015-05-265.4%5.2%
2015-04-225.1%5.4%
2015-03-245.4%5.1%
2015-02-265.3%5.4%
2015-01-224.5%5.3%
2014-12-234.3%4.5%
2014-11-254.8%4.3%
2014-10-234.4%4.8%
2014-09-235.1%4.4%
2014-08-265.5%5.1%
2014-07-225.9%5.5%
2014-06-246.5%5.9%6.1%
2014-05-276.9%6.5%6.5%
2014-04-227.4%6.9%
2014-03-257.7%7.4%7.3%
2014-02-257.6%7.7%7.7%
2014-01-238.2%7.6%8.0%
2013-12-248.5%8.2%8.3%
2013-11-268.5%8.5%
2013-10-238.8%8.5%7.1%
2013-09-247.7%8.8%7.2%
2013-08-227.3%7.7%6.0%
2013-07-237.4%7.3%5.4%
2013-06-257.2%7.4%
2013-05-017.30%7.2%
2013-04-017.20%7.30%
2013-03-016.50%7.20%
2013-02-015.50%6.50%
2013-01-015.50%5.50%
2012-12-015.30%5.50%
2012-11-014.10%5.30%
2012-10-014.20%4.10%
2012-09-013.40%4.20%
2012-08-013.50%3.40%
2012-07-013.60%3.50%
2012-06-012.80%3.60%
2012-05-012.30%2.80%
2012-04-010.30%2.30%
2012-03-01-0.90%0.30%
2012-02-01-1.20%-0.90%
2012-01-01-2.30%-1.20%
2011-12-01-3.00%-2.30%
2011-11-01-2.50%-3.00%
2011-10-01-3.90%-2.50%
2011-09-01-3.60%-3.90%
2011-08-01-4.50%-3.60%
2011-07-01-6.00%-4.50%
2011-06-01-5.80%-6.00%
2011-05-01-5.90%-5.80%
2011-04-01-4.90%-5.90%
2011-03-01-4.40%-4.90%
2011-02-01-3.80%-4.40%
2011-01-01-4.30%-3.80%
2010-12-01-3.70%-4.30%
2010-11-01-3.40%-3.70%
2010-10-01-2.70%-3.40%
2010-09-01-2.80%-2.70%
2010-08-01-2.40%-2.80%
2010-07-01-1.30%-2.40%
2010-06-01-1.60%-1.30%
2010-05-01-2.30%-1.60%
2010-04-01-3.50%-2.30%
2010-03-01-2.70%-3.50%
2010-02-01-2.00%-2.70%
2010-01-01-1.00%-2.00%
2009-12-01-3.00%-1.00%
2009-11-01-4.30%-3.00%
2009-10-01-5.00%-4.30%
2009-09-01-5.70%-5.00%
2009-08-01-6.30%-5.70%
2009-07-01-6.80%-6.30%
2009-06-01-7.60%-6.80%
2009-05-01-8.10%-7.60%
2009-04-01-7.80%-8.10%
2009-03-01-8.50%-7.80%
2009-02-01-10.20%-8.50%
2009-01-01-10.50%-10.20%
2008-12-01-9.50%-10.50%
2008-11-01-9.30%-9.50%
2008-10-01-8.80%-9.30%
2008-09-01-8.40%-8.80%
2008-08-01-8.00%-8.40%
2008-07-01-7.70%-8.00%
2008-06-01-7.20%-7.70%
2008-05-01-6.20%-7.20%
2008-04-01-4.80%-6.20%
2008-03-01-4.40%-4.80%
2008-02-01-3.10%-4.40%
2008-01-01-2.60%-3.10%
2007-12-01-1.70%-2.60%
2007-11-01-0.80%-1.70%
2007-10-01-0.40%-0.80%
2007-09-010.30%-0.40%
2007-08-010.80%0.30%
2007-07-011.10%0.80%
2007-06-011.90%1.10%
2007-05-012.10%1.90%
2007-04-012.00%2.10%
2007-03-012.20%2.00%
2007-02-012.60%2.20%
2007-01-013.10%2.60%
2006-12-013.40%3.10%
2006-11-013.90%3.40%
2006-10-014.90%3.90%
2006-09-015.40%4.90%
2006-08-016.40%5.40%
2006-07-017.30%6.40%
2006-06-017.90%7.30%
2006-05-018.60%7.90%
2006-04-019.30%8.60%
2006-03-019.90%9.30%
2006-02-019.90%9.90%
2006-01-0110.20%9.90%
2005-12-0110.50%10.20%
2005-11-0110.70%10.50%
2005-10-0110.50%10.70%
2005-09-0110.50%10.50%
2005-08-0110.30%10.50%
2005-07-0110.50%10.30%
2005-06-0110.70%10.50%
2005-05-0110.60%10.70%
2005-04-0110.30%10.60%
2005-03-0110.30%10.30%
2005-02-0110.30%10.30%
2005-01-0110.30%10.30%
2004-12-0110.10%10.30%
2004-11-019.90%10.10%
2004-10-019.90%9.90%
2004-09-0110.00%9.90%
2004-08-019.90%10.00%
2004-07-019.30%9.90%
2004-06-018.80%9.30%
2004-05-018.60%8.80%
2004-04-018.30%8.60%
2004-03-018.10%8.30%
2004-02-018.00%8.10%
2004-01-017.90%8.00%
2003-12-017.70%7.90%
2003-11-017.80%7.70%
2003-10-017.60%7.80%
2003-09-017.50%7.60%
2003-08-017.40%7.50%
2003-07-017.50%7.40%
2003-06-017.70%7.50%
2003-05-017.60%7.70%
2003-04-017.90%7.60%
2003-03-017.80%7.90%
2003-02-017.80%7.80%
2003-01-017.80%7.80%
2002-12-017.50%7.80%
2002-11-017.40%7.50%
2002-10-017.30%7.40%
2002-09-017.10%7.30%
2002-08-017.00%7.10%
2002-07-016.90%7.00%
2002-06-016.60%6.90%
2002-05-016.60%6.60%
2002-04-016.60%6.60%
2002-03-016.70%6.60%
2002-02-016.70%6.70%
2002-01-016.60%6.70%
2001-12-017.00%6.60%
2001-11-016.90%7.00%
2001-10-017.00%6.90%
2001-09-016.90%7.00%
2001-08-016.90%6.90%
2001-07-017.10%6.90%
2001-06-017.10%7.10%
2001-05-017.20%7.10%
2001-04-017.40%7.20%
2001-03-016.70%7.40%
2001-02-017.20%6.70%
2001-01-017.10%7.20%
2000-12-016.80%7.10%
2000-11-016.90%6.80%
14:00
House Price Index (Sep) 435,6   435,4
OpisOFHEO's House Price Index (HPI) is a measure designed to capture changes in the value of single-family homes in the U.S. as a whole, in various regions of the country. The HPI is published by OFHEO using data provided by Fannie Mae and Freddie Mac. House price index is a statistic designed to reflect the average change of house prices across the country or a certain area. It ensures that the relative importance of different property types in different regions remains fixed throughout the life of the index. Different adjustment must be used as no two houses are identical. Therefore characteristics such as physical attributes of a house or its location should be included in the calculation if the index. Rising house prices are likely to increase consumer confidence and consumer spending which lead to rising aggregate demand. This can have two effects. On one hand it causes higher economic growth. However, on the other hand, it might contribute to inflation. Increased consumer spending is usually aimed at imported goods thus higher house prices cause current account deficit.
PriorytetNiski
DataPoprzednia wartośćKolejna wartośćPrzewidywana wartość
2025-10-28433.6435.3
2025-09-30433.9433.6
2025-08-26434.6433.9
2025-07-29435.1434.6
2025-06-24436.7435.1
2025-05-27436.8436.7
2025-04-29436.7436.8
2025-03-25435.8436.7
2025-02-25434.3435.8
2025-01-28432.3434.3
2024-12-31430.6432.3
2024-11-26427.4430.6
2024-10-29425.8427.4
2024-09-24424.7425.8
2024-08-27424.8424.7
2024-07-30424.7424.8
2024-06-25423.3424.7
2024-05-28423.0423.3
2024-04-30417.8423.0
2024-03-26417.8417.8
2024-02-27417.4417.8
2024-01-30416.1417.4
2023-12-26414.9416.1
2023-11-28412.2414.9
2023-10-31409.4412.2
2023-09-26406.1409.4
2023-08-29404.4406.1
2023-07-25401.2404.4404.6
2023-06-27398.3401.2402.1
2023-05-30395.5398.3393.0
2023-04-25393.0395.5392.8
2023-03-28392.4393.0
2023-02-28392.4392.4
2023-01-31392.8392.4
2022-12-27392.7392.8
2022-11-29392.0392.7
2022-10-25394.6392.0
2022-09-27397.6394.6
2022-08-30397.6397.6
2022-07-26392.7397.6
2022-06-28386.8392.7
2022-05-31381.0386.8
2022-04-26373.7381.0
2022-03-29367.6373.7
2022-02-22362.8367.6
2022-01-25358.4362.8
2021-12-28354.4358.4
2021-11-30351.5354.4
2021-10-26348.2351.5
2021-09-28343.5348.2
2021-08-31337.8343.5
2021-07-27331.6337.8
2021-06-29325.5331.6
2021-05-25320.3325.5
2021-04-27316.8320.3
2021-03-30313.6316.8
2021-02-23310.0313.6
2021-01-26307.0310.0
2020-12-23302.5307.0
2020-11-24297.5302.5
2020-10-27293.3297.5
2020-09-23290.0293.3
2020-08-25287.2290.0
2020-07-22288.0287.2
2020-06-24287.7288.0
2020-05-26287.4287.7
2020-04-22284.9287.4
2020-03-25283.0284.9
2020-02-25281.3283.0
2020-01-22280.2281.3
2019-12-31279.2280.2
2019-11-26277.4279.2
2019-10-23276.9277.4
2019-09-24275.6276.9
2019-08-27275.2275.6
2019-07-23274.8275.2
2019-06-25273.4274.8
2019-05-28273.1273.4
2019-04-23272.1273.1
2019-03-26270.4272.1
2019-02-26269.4270.4
2019-01-23268.2269.4
2018-12-27267.0268.2
2018-11-27266.4267.0
2018-10-24265.4266.4
2018-09-25264.4265.4
2018-08-23263.6264.4
2018-07-24262.6263.6
2018-06-21262.1262.6
2018-05-24261.6262.1
2018-04-24259.5261.6
2018-03-22257.3259.5
2018-02-27256.2257.3
2018-01-24255.0256.2
2017-12-21253.3255.0
2017-11-28252.2253.3
2017-10-25250.2252.2
2017-09-21249.4250.2
2017-08-22249.1249.4
2017-07-25248.3249.1
2017-06-22246.6248.3
2017-05-24244.8246.6
2017-04-25242.9244.8
2017-03-22242.5242.9
2017-02-23241.6242.5
2017-01-25240.0241.6
2016-12-22239.3240.0
2016-11-23237.9239.3
2016-10-25236.2237.9
2016-09-22235.0236.2
2016-08-24234.3235.0
2016-07-21233.8234.3
2016-06-22233.2233.8
2016-05-25231.5233.2
2016-04-21230.5231.5
2016-03-22229.5230.5
2016-02-25228.6229.5
2016-01-26227.6228.6
2015-12-22226.4227.6
2015-11-25224.8226.4
2015-10-22224.3224.8
2015-09-22223.2224.3
2015-08-25222.9223.2
2015-07-22221.8222.9
2015-06-23221.1221.8
2015-05-26220.2221.1
2015-04-22219.0220.2
2015-03-24218.3219.0
2015-02-26216.8218.3
2015-01-22215.2216.8
2014-12-23214.2215.2
2014-11-25213.9214.2
2014-10-23213.1213.9
2014-09-23212.5213.1
2014-08-26211.9212.5
2014-07-01211.20211.9
2014-06-01210.60211.20
2014-05-01210.20210.60
2014-04-01209.10210.20
2014-03-01208.30209.10
2014-02-01207.10208.30
2014-01-01205.70207.10
2013-12-01205.70205.70
2013-11-01204.70205.70
2013-10-01203.70204.70
2013-09-01202.80203.70
2013-08-01201.40202.80
2013-07-01200.20201.40
2013-06-01198.60200.20
2013-05-01197.70198.60
2013-04-01195.40197.70
2013-03-01193.90195.40
2013-02-01192.40193.90
2013-01-01191.50192.40
2012-12-01190.50191.50
2012-11-01189.20190.50
2012-10-01188.30189.20
2012-09-01187.30188.30
2012-08-01187.00187.30
2012-07-01186.50187.00
2012-06-01185.30186.50
2012-05-01184.20185.30
2012-04-01182.40184.20
2012-03-01182.20182.40
2012-02-01182.30182.20
2012-01-01181.60182.30
2011-12-01180.80181.60
2011-11-01181.80180.80
2011-10-01180.70181.80
2011-09-01181.20180.70
2011-08-01180.80181.20
2011-07-01180.00180.80
2011-06-01180.30180.00
2011-05-01180.00180.30
2011-04-01181.80180.00
2011-03-01183.80181.80
2011-02-01184.60183.80
2011-01-01185.80184.60
2010-12-01186.40185.80
2010-11-01186.30186.40
2010-10-01188.00186.30
2010-09-01188.10188.00
2010-08-01189.30188.10
2010-07-01191.60189.30
2010-06-01191.40191.60
2010-05-01191.40191.40
2010-04-01191.20191.40
2010-03-01192.40191.20
2010-02-01191.90192.40
2010-01-01194.10191.90
2009-12-01193.50194.10
2009-11-01192.90193.50
2009-10-01193.20192.90
2009-09-01193.50193.20
2009-08-01194.00193.50
2009-07-01194.20194.00
2009-06-01194.60194.20
2009-05-01195.80194.60
2009-04-01198.10195.80
2009-03-01197.70198.10
2009-02-01195.90197.70
2009-01-01196.10195.90
2008-12-01199.50196.10
2008-11-01201.60199.50
2008-10-01203.40201.60
2008-09-01205.20203.40
2008-08-01207.00205.20
2008-07-01208.40207.00
2008-06-01210.70208.40
2008-05-01213.00210.70
2008-04-01214.90213.00
2008-03-01216.00214.90
2008-02-01218.10216.00
2008-01-01219.10218.10
2007-12-01220.50219.10
2007-11-01222.20220.50
2007-10-01223.10222.20
2007-09-01224.00223.10
2007-08-01225.10224.00
2007-07-01225.90225.10
2007-06-01226.90225.90
2007-05-01227.00226.90
2007-04-01225.80227.00
2007-03-01226.00225.80
2007-02-01225.10226.00
2007-01-01224.90225.10
2006-12-01224.30224.90
2006-11-01224.00224.30
2006-10-01224.00224.00
2006-09-01223.40224.00
2006-08-01223.30223.40
2006-07-01223.30223.30
2006-06-01222.70223.30
2006-05-01222.40222.70
2006-04-01221.40222.40
2006-03-01221.00221.40
2006-02-01219.50221.00
2006-01-01218.20219.50
2005-12-01216.80218.20
2005-11-01215.60216.80
2005-10-01213.60215.60
2005-09-01212.00213.60
2005-08-01209.90212.00
2005-07-01208.20209.90
2005-06-01206.50208.20
2005-05-01204.70206.50
2005-04-01202.70204.70
2005-03-01201.20202.70
2005-02-01199.70201.20
2005-01-01198.10199.70
2004-12-01196.20198.10
2004-11-01194.80196.20
2004-10-01193.30194.80
2004-09-01191.90193.30
2004-08-01190.30191.90
2004-07-01188.40190.30
2004-06-01186.60188.40
2004-05-01185.00186.60
2004-04-01183.80185.00
2004-03-01182.40183.80
2004-02-01181.10182.40
2004-01-01179.60181.10
2003-12-01178.30179.60
2003-11-01177.20178.30
2003-10-01175.80177.20
2003-09-01174.50175.80
2003-08-01173.20174.50
2003-07-01172.40173.20
2003-06-01171.40172.40
2003-05-01170.40171.40
2003-04-01169.80170.40
2003-03-01168.80169.80
2003-02-01167.70168.80
2003-01-01166.60167.70
2002-12-01165.60166.60
2002-11-01164.50165.60
2002-10-01163.40164.50
2002-09-01162.30163.40
2002-08-01161.30162.30
2002-07-01160.30161.30
2002-06-01159.30160.30
2002-05-01158.40159.30
2002-04-01157.40158.40
2002-03-01156.50157.40
2002-02-01155.60156.50
2002-01-01154.60155.60
2001-12-01154.10154.60
2001-11-01153.20154.10
2001-10-01152.40153.20
2001-09-01151.60152.40
2001-08-01150.70151.60
2001-07-01150.00150.70
2001-06-01149.40150.00
2001-05-01148.50149.40
2001-04-01147.70148.50
2001-03-01146.70147.70
2001-02-01145.80146.70
2001-01-01145.00145.80
2000-12-01144.00145.00
2000-11-01143.20144.00
14:00
S&P/CS HPI Composite - 20 s.a. (MoM) (Sep) 0,1%   0,1%
OpisHouse price index is a statistic designed to reflect the average change of house prices across the country or a certain area.It ensures that the relative importance of different property types in different regions remains fixed throughout the life of the index.Different adjustment must be used as no two houses are identical. Therefore characteristics such as physical attributes of a house or its location should be included in the calculation if the index. Rising house prices are likely to increase consumer confidence and consumer spending which lead to rising aggregate demand. This can have two effects. On one hand it causes higher economic growth. However, on the other hand, it might contribute to inflation. Increased consumer spending is usually aimed at imported goods thus higher house prices cause current account deficit.
PriorytetNiski
DataPoprzednia wartośćKolejna wartośćPrzewidywana wartość
2025-10-28-0.1%0.2%
2025-09-30-0.2%-0.1%
2025-08-26-0.3%-0.2%
2025-07-29-0.3%-0.3%
2025-06-24-0.2%-0.3%
2025-05-270.4%-0.2%
2025-04-290.4%0.4%
2025-03-250.5%0.4%
2025-02-250.4%0.5%
2025-01-280.4%0.4%
2024-12-310.2%0.4%0.2%
2024-11-260.3%0.2%
2024-10-290.3%0.3%
2024-09-240.5%0.3%
2024-08-270.4%0.5%0.3%
2024-07-300.4%0.4%0.3%
2024-06-250.3%0.4%0.3%
2024-05-280.6%0.3%0.3%
2024-04-300.2%0.6%0.1%
2024-03-260.3%0.2%
2024-02-270.2%0.3%0.2%
2024-01-300.6%0.2%0.5%
2023-12-260.7%0.6%
2023-11-280.8%0.7%
2023-10-310.8%0.8%
2023-09-260.9%0.8%
2023-08-291.0%0.9%1.2%
2023-07-250.9%1.0%1.5%
2023-06-270.4%0.9%0.5%
2023-05-30-0.1%0.4%-0.4%
2023-04-25-0.4%-0.1%-0.4%
2023-03-28-0.5%-0.4%-0.5%
2023-02-28-0.5%-0.5%-0.5%
2023-01-31-0.5%-0.5%-0.6%
2022-12-27-1.3%-0.5%-1.1%
2022-11-29-1.3%-1.3%-1.2%
2022-10-25-0.7%-1.3%-0.5%
2022-09-270.2%-0.7%0.2%
2022-08-301.2%0.2%1.0%
2022-07-261.7%1.2%1.5%
2022-06-282.4%1.7%2.0%
2022-05-312.4%2.4%2.0%
2022-04-261.7%2.4%1.5%
2022-03-291.4%1.7%1.5%
2022-02-221.2%1.4%1.1%
2022-01-251.0%1.2%0.9%
2021-12-281.0%1.0%0.9%
2021-11-301.2%1.0%1.2%
2021-10-261.5%1.2%1.5%
2021-09-281.8%1.5%1.7%
2021-08-311.8%1.8%1.8%
2021-07-271.7%1.8%1.6%
2021-06-291.6%1.7%1.7%
2021-05-251.2%1.6%1.2%
2021-04-271.2%1.2%1.1%
2021-03-301.3%1.2%1.2%
2021-02-231.5%1.3%1.3%
2021-01-261.6%1.5%1.0%
2020-12-291.4%1.6%1.0%
2020-11-241.4%1.4%0.7%
2020-10-270.7%1.4%0.5%
2020-09-290.0%0.7%0.3%
2020-08-250.0%0.0%0.1%
2020-07-280.2%0.0%0.3%
2020-06-300.5%0.2%0.5%
2020-05-260.5%0.5%0.2%
2020-04-280.3%0.5%0.4%
2020-03-310.4%0.3%0.4%
2020-02-250.5%0.4%0.5%
2020-01-280.5%0.5%0.4%
2019-12-310.3%0.5%0.4%
2019-11-260.2%0.3%0.3%
2019-10-290.1%0.2%0.1%
2019-09-240.1%0.1%0.1%
2019-08-270.1%0.1%0.2%
2019-07-300.3%0.1%0.2%
2019-06-250.3%0.3%0.2%
2019-05-280.3%0.3%0.2%
2019-04-300.1%0.3%0.2%
2019-03-260.2%0.1%0.3%
2019-02-260.3%0.2%0.3%
2019-01-290.4%0.3%0.4%
2018-12-260.7%0.4%0.2%
2018-11-270.1%0.7%0.2%
2018-10-300.1%0.1%0.1%
2018-09-250.2%0.1%0.1%
2018-08-280.2%0.2%0.2%
2018-07-310.2%0.2%0.2%
2018-06-260.4%0.2%0.4%
2018-05-290.8%0.4%0.7%
2018-04-240.8%0.8%0.7%
2018-03-270.7%0.8%0.7%
2018-02-270.7%0.7%0.6%
2018-01-300.7%0.7%0.7%
2017-12-261.0%0.7%0.7%
2017-11-280.4%1.0%0.4%
2017-10-310.4%0.4%0.3%
2017-09-260.1%0.4%0.2%
2017-08-290.1%0.1%0.2%
2017-07-25-0.2%0.1%0.3%
2017-06-270.5%-0.2%0.4%
2017-05-300.7%0.5%0.9%
2017-04-250.9%0.7%0.8%
2017-03-280.9%0.9%0.7%
2017-02-280.9%0.9%0.7%
2017-01-310.7%0.9%0.7%
2016-12-270.5%0.7%0.5%
2016-11-290.3%0.5%0.4%
2016-10-250.0%0.3%0.1%
2016-09-27-0.1%0.0%
2016-08-30-0.1%-0.1%-0.1%
2016-07-26-0.2%-0.1%-0.1%
2016-06-280.8%-0.2%0.6%
2016-05-310.7%0.8%0.8%
2016-04-260.8%0.7%0.8%
2016-03-290.8%0.8%0.7%
2016-02-231.0%0.8%0.9%
2016-01-260.8%1.0%0.8%
2015-12-290.5%0.8%0.5%
2015-11-240.1%0.5%0.3%
2015-10-27-0.2%0.1%0.1%
2015-09-29-0.2%-0.2%0.1%
2015-08-25-0.1%-0.2%0.1%
2015-07-280.3%-0.1%0.3%
2015-06-301.0%0.3%0.8%
2015-05-261.2%1.0%0.9%
2015-04-280.9%1.2%0.8%
2015-03-310.9%0.9%0.6%
2015-02-240.8%0.9%0.6%
2015-01-270.7%0.8%0.6%
2014-12-300.2%0.7%0.5%
2014-11-25-0.1%0.2%
2014-10-28-0.5%-0.1%0.1%
2014-09-30-0.3%-0.5%0.1%
2014-08-26-0.3%-0.3%0.0%
2014-07-01-0.40%-0.3%
2014-06-010.20%-0.40%
2014-05-011.00%0.20%
2014-04-010.70%1.00%
2014-03-010.80%0.70%
2014-02-010.70%0.80%
2014-01-010.90%0.70%
2013-12-011.00%0.90%
2013-11-011.00%1.00%
2013-10-011.10%1.00%
2013-09-010.90%1.10%
2013-08-011.00%0.90%
2013-07-011.00%1.00%
2013-06-011.60%1.00%
2013-05-011.50%1.60%
2013-04-011.10%1.50%
2013-03-011.00%1.10%
2013-02-011.00%1.00%
2013-01-010.80%1.00%
2012-12-010.70%0.80%
2012-11-010.60%0.70%
2012-10-010.60%0.60%
2012-09-010.50%0.60%
2012-08-011.00%0.50%
2012-07-010.90%1.00%
2012-06-010.50%0.90%
2012-05-010.30%0.50%
2012-04-010.00%0.30%
2012-03-01-0.10%0.00%
2012-02-01-0.40%-0.10%
2012-01-01-0.50%-0.40%
2011-12-01-0.60%-0.50%
2011-11-01-0.50%-0.60%
2011-10-01-0.30%-0.50%
2011-09-01-0.10%-0.30%
2011-08-010.00%-0.10%
2011-07-01-0.30%0.00%
2011-06-01-0.20%-0.30%
2011-05-01-0.60%-0.20%
2011-04-01-0.30%-0.60%
2011-03-01-0.20%-0.30%
2011-02-01-0.20%-0.20%
2011-01-01-0.20%-0.20%
2010-12-01-0.70%-0.20%
2010-11-01-0.70%-0.70%
2010-10-01-0.60%-0.70%
2010-09-01-0.50%-0.60%
2010-08-01-0.10%-0.50%
2010-07-010.10%-0.10%
2010-06-010.10%0.10%
2010-05-010.00%0.10%
2010-04-010.00%0.00%
2010-03-010.50%0.00%
2010-02-010.50%0.50%
2010-01-010.50%0.50%
2009-12-010.50%0.50%
2009-11-010.40%0.50%
2009-10-010.80%0.40%
2009-09-010.70%0.80%
2009-08-010.40%0.70%
2009-07-01-0.50%0.40%
2009-06-01-1.20%-0.50%
2009-05-01-1.60%-1.20%
2009-04-01-1.40%-1.60%
2009-03-01-2.00%-1.40%
2009-02-01-1.90%-2.00%
2009-01-01-1.70%-1.90%
2008-12-01-1.80%-1.70%
2008-11-01-1.80%-1.80%
2008-10-01-1.40%-1.80%
2008-09-01-1.70%-1.40%
2008-08-01-1.40%-1.70%
2008-07-01-1.70%-1.40%
2008-06-01-1.80%-1.70%
2008-05-01-1.70%-1.80%
2008-04-01-2.00%-1.70%
2008-03-01-1.60%-2.00%
2008-02-01-1.50%-1.60%
2008-01-01-1.60%-1.50%
2007-12-01-1.10%-1.60%
2007-11-01-0.90%-1.10%
2007-10-01-1.00%-0.90%
2007-09-01-1.00%-1.00%
2007-08-01-1.10%-1.00%
2007-07-01-0.90%-1.10%
2007-06-01-0.70%-0.90%
2007-05-010.10%-0.70%
2007-04-010.20%0.10%
2007-03-010.10%0.20%
2007-02-01-0.10%0.10%
2007-01-010.00%-0.10%
2006-12-010.00%0.00%
2006-11-01-0.20%0.00%
2006-10-01-0.40%-0.20%
2006-09-01-0.40%-0.40%
2006-08-01-0.30%-0.40%
2006-07-01-0.10%-0.30%
2006-06-010.10%-0.10%
2006-05-010.50%0.10%
2006-04-010.80%0.50%
2006-03-010.80%0.80%
2006-02-011.00%0.80%
2006-01-011.10%1.00%
2005-12-011.20%1.10%
2005-11-011.20%1.20%
2005-10-011.00%1.20%
2005-09-011.00%1.00%
2005-08-011.10%1.00%
2005-07-011.10%1.10%
2005-06-011.20%1.10%
2005-05-011.70%1.20%
2005-04-011.50%1.70%
2005-03-011.40%1.50%
2005-02-011.20%1.40%
2005-01-011.00%1.20%
2004-12-011.00%1.00%
2004-11-011.00%1.00%
2004-10-011.00%1.00%
2004-09-011.30%1.00%
2004-08-011.60%1.30%
2004-07-011.50%1.60%
2004-06-011.50%1.50%
2004-05-011.60%1.50%
2004-04-011.30%1.60%
2004-03-011.20%1.30%
2004-02-011.30%1.20%
2004-01-011.20%1.30%
2003-12-011.20%1.20%
2003-11-011.20%1.20%
2003-10-011.00%1.20%
2003-09-010.90%1.00%
2003-08-010.50%0.90%
2003-07-010.70%0.50%
2003-06-010.60%0.70%
2003-05-010.70%0.60%
2003-04-010.70%0.70%
2003-03-010.80%0.70%
2003-02-011.00%0.80%
2003-01-010.90%1.00%
2002-12-011.00%0.90%
2002-11-010.90%1.00%
2002-10-011.10%0.90%
2002-09-011.20%1.10%
2002-08-011.20%1.20%
2002-07-011.10%1.20%
2002-06-011.00%1.10%
2002-05-010.90%1.00%
2002-04-010.70%0.90%
2002-03-010.60%0.70%
2002-02-010.30%0.60%
2002-01-010.50%0.30%
2001-12-010.60%0.50%
2001-11-010.70%0.60%
2001-10-010.60%0.70%
2001-09-010.50%0.60%
2001-08-010.50%0.50%
2001-07-010.40%0.50%
2001-06-010.70%0.40%
2001-05-010.80%0.70%
2001-04-011.00%0.80%
2001-03-011.10%1.00%
2001-02-011.10%1.10%
2001-01-011.00%1.10%
2000-12-010.80%1.00%
2000-11-010.70%0.80%
14:00
S&P/CS HPI Composite - 20 n.s.a. (YoY) (Sep) 1,6% 1,4% 1,4%
OpisThe S&P/Case-Shiller House Price Index measures the change in the selling price of single-family homes in 20 metropolitan areas.A higher than expected reading should be taken as positive/bullish for the USD,while a lower than expected reading should be taken as negative/bearish for the USD.
Priorytet Średni
DataPoprzednia wartośćKolejna wartośćPrzewidywana wartość
2025-10-281.8%1.6%1.4%
2025-09-302.2%1.8%1.7%
2025-08-262.8%2.2%2.1%
2025-07-293.4%2.8%2.9%
2025-06-244.1%3.4%4.0%
2025-05-274.5%4.1%4.5%
2025-04-294.7%4.5%4.6%
2025-03-254.5%4.7%4.6%
2025-02-254.3%4.5%4.4%
2025-01-284.2%4.3%4.2%
2024-12-314.6%4.2%4.1%
2024-11-265.2%4.6%4.7%
2024-10-295.9%5.2%4.9%
2024-09-246.5%5.9%5.9%
2024-08-276.9%6.5%6.2%
2024-07-307.3%6.9%6.5%
2024-06-257.5%7.3%7.0%
2024-05-287.3%7.5%7.3%
2024-04-306.6%7.3%6.7%
2024-03-266.2%6.6%6.6%
2024-02-275.4%6.2%6.0%
2024-01-304.9%5.4%5.8%
2023-12-263.9%4.9%5.0%
2023-11-282.1%3.9%4.0%
2023-10-310.2%2.1%1.6%
2023-09-26-1.2%0.2%-0.3%
2023-08-29-1.7%-1.2%-1.3%
2023-07-25-1.7%-1.7%-2.2%
2023-06-27-1.1%-1.7%-2.6%
2023-05-300.4%-1.1%-1.6%
2023-04-252.6%0.4%0.1%
2023-03-284.6%2.6%2.5%
2023-02-286.8%4.6%5.8%
2023-01-318.7%6.8%6.8%
2022-12-2710.4%8.7%8.2%
2022-11-2913.1%10.4%10.8%
2022-10-2516.0%13.1%14.4%
2022-09-2718.7%16.0%17.0%
2022-08-3020.5%18.7%19.5%
2022-07-2621.2%20.5%20.6%
2022-06-2821.1%21.2%21.0%
2022-05-3120.3%21.1%20.0%
2022-04-2618.9%20.3%19.0%
2022-03-2918.6%18.9%18.4%
2022-02-2218.3%18.6%18.0%
2022-01-2518.5%18.3%18.0%
2021-12-2819.1%18.5%18.5%
2021-11-3019.6%19.1%19.3%
2021-10-2620.0%19.6%20.0%
2021-09-2819.1%20.0%20.0%
2021-08-3117.1%19.1%18.5%
2021-07-2715.0%17.1%16.4%
2021-06-2913.4%15.0%14.5%
2021-05-2512.0%13.4%12.3%
2021-04-2711.1%12.0%11.7%
2021-03-3010.2%11.1%11.0%
2021-02-239.2%10.2%9.9%
2021-01-268.0%9.2%8.6%
2020-12-296.6%8.0%6.9%
2020-11-245.3%6.6%5.1%
2020-10-274.1%5.3%4.2%
2020-09-293.5%4.1%3.8%
2020-08-253.6%3.5%3.8%
2020-07-283.9%3.6%4.0%
2020-06-303.9%3.9%4.0%
2020-05-263.5%3.9%3.3%
2020-04-283.1%3.5%3.2%
2020-03-312.8%3.1%3.2%
2020-02-252.5%2.8%2.8%
2020-01-282.2%2.5%2.4%
2019-12-312.1%2.2%2.2%
2019-11-262.0%2.1%2.1%
2019-10-292.0%2.0%2.1%
2019-09-242.2%2.0%2.2%
2019-08-272.4%2.2%2.5%
2019-07-302.5%2.4%2.4%
2019-06-252.6%2.5%2.6%
2019-05-283.0%2.6%3.1%
2019-04-303.5%3.0%3.7%
2019-03-264.1%3.5%4.3%
2019-02-264.6%4.1%4.9%
2019-01-295.0%4.6%4.9%
2018-12-265.2%5.0%4.8%
2018-11-275.5%5.2%5.3%
2018-10-305.9%5.5%6.0%
2018-09-256.4%5.9%6.2%
2018-08-286.5%6.4%6.5%
2018-07-316.7%6.5%6.4%
2018-06-266.7%6.7%6.9%
2018-05-296.8%6.7%6.5%
2018-04-246.4%6.8%6.3%
2018-03-276.3%6.4%6.2%
2018-02-276.4%6.3%6.3%
2018-01-306.3%6.4%6.3%
2017-12-266.2%6.3%6.3%
2017-11-285.8%6.2%6.1%
2017-10-315.8%5.8%6.0%
2017-09-265.6%5.8%5.8%
2017-08-295.7%5.6%5.7%
2017-07-255.7%5.7%5.8%
2017-06-275.9%5.7%5.9%
2017-05-305.9%5.9%5.7%
2017-04-255.7%5.9%5.7%
2017-03-285.5%5.7%5.6%
2017-02-285.2%5.5%5.3%
2017-01-315.1%5.2%5.1%
2016-12-275.0%5.1%5.1%
2016-11-295.1%5.0%5.2%
2016-10-255.0%5.1%5.0%
2016-09-275.1%5.0%5.1%
2016-08-305.2%5.1%5.2%
2016-07-265.4%5.2%5.5%
2016-06-285.5%5.4%5.4%
2016-05-315.4%5.5%5.2%
2016-04-265.7%5.4%5.5%
2016-03-295.7%5.7%5.8%
2016-02-235.7%5.7%5.8%
2016-01-265.5%5.7%5.7%
2015-12-295.5%5.5%5.4%
2015-11-245.1%5.5%5.1%
2015-10-275.0%5.1%5.1%
2015-09-294.9%5.0%5.1%
2015-08-254.9%4.9%5.1%
2015-07-284.9%4.9%5.6%
2015-06-305.0%4.9%5.5%
2015-05-265.0%5.0%4.6%
2015-04-284.6%5.0%4.7%
2015-03-314.4%4.6%4.5%
2015-02-244.3%4.4%4.3%
2015-01-274.5%4.3%4.3%
2014-12-304.9%4.5%4.5%
2014-11-255.6%4.9%4.7%
2014-10-286.7%5.6%5.8%
2014-09-308.1%6.7%7.5%
2014-08-269.3%8.1%8.4%
2014-07-2910.8%9.3%10.0%
2014-06-2412.4%10.8%11.6%
2014-05-2712.9%12.4%11.8%
2014-04-2913.2%12.9%13.0%
2014-03-2513.4%13.2%13.3%
2014-02-2513.7%13.4%13.3%
2014-01-2813.6%13.7%13.7%
2013-12-3113.3%13.6%13.0%
2013-11-2612.8%13.3%13.0%
2013-10-2912.3%12.8%12.5%
2013-09-2412.1%12.3%12.4%
2013-08-2712.2%12.1%12.1%
2013-07-3012.1%12.2%12.4%
2013-06-2510.9%12.1%10.6%
2013-05-289.3%10.9%10.2%
2013-04-308.1%9.3%9.0%
2013-03-266.8%8.1%7.9%
2013-02-265.5%6.8%6.6%
2013-01-294.2%5.5%5.5%
2012-12-263.0%4.2%4.0%
2012-11-272.0%3.0%2.9%
2012-10-301.2%2.0%1.9%
2012-09-250.5%1.2%1.0%
2012-08-28-0.7%0.5%-0.1%
2012-07-31-1.9%-0.7%-1.5%
2012-06-26-2.6%-1.9%-2.5%
2012-05-29-3.5%-2.6%-2.6%
2012-04-24-3.8%-3.5%-3.4%
2012-03-27-4.1%-3.8%-3.8%
2012-02-28-3.9%-4.1%-3.6%
2012-01-31-3.4%-3.9%-3.2%
2011-12-27-3.5%-3.4%-3.2%
2011-11-29-3.8%-3.5%-3.0%
2011-10-25-4.2%-3.8%-3.5%
2011-09-27-4.4%-4.2%-4.4%
2011-08-30-4.6%-4.4%-4.7%
2011-07-26-4.2%-4.6%-4.4%
2011-06-28-3.8%-4.2%-3.9%
2011-05-31-3.4%-3.8%-3.4%
2011-04-26-3.1%-3.4%-3.2%
2011-03-29-2.4%-3.1%-3.3%
2011-02-22-1.6%-2.4%-2.4%
2011-01-25-0.8%-1.6%-1.3%
2010-12-280.4%-0.8%-0.1%
2010-11-301.7%0.4%1.0%
2010-10-263.2%1.7%2.0%
2010-09-284.2%3.2%3.4%
2010-08-314.6%4.2%3.5%
2010-07-273.8%4.6%4.0%
2010-06-292.3%3.8%3.4%
2010-05-250.7%2.3%2.8%
2010-04-27-0.7%0.7%1.4%
2010-03-30-3.1%-0.7%-0.5%
2010-02-23-5.3%-3.1%-3.0%
2010-01-26-7.3%-5.3%-5.0%
2009-12-29-9.3%-7.3%-7.3%
2009-11-24-11.3%-9.3%-9.1%
2009-10-27-13.3%-11.3%-11.9%
2009-09-29-15.4%-13.3%-14.4%
2009-08-25-17.0%-15.4%-16.3%
2009-07-28-18.1%-17.0%-17.8%
2009-06-30-18.7%-18.1%-18.6%
2009-05-26-18.7%-18.7%-18.4%
2009-04-28-19.0%-18.7%-18.9%
2009-03-31-18.5%-19.0%-18.5%
2009-02-24-18.2%-18.5%-18.3%
2009-01-27-18.0%-18.2%-18.4%
2008-12-30-17.4%-18.0%-17.8%
2008-11-25-16.6%-17.4%-17.0%
2008-10-28-16.3%-16.6%-16.6%
2008-09-30-15.9%-16.3%-16.1%
2008-08-26-15.8%-15.9%-16.2%
2008-07-29-15.3%-15.8%-16.2%
2008-06-24-14.4%-15.3%-16.0%
2008-05-27-12.7%-14.4%-14.3%
2008-04-29-10.7%-12.7%-12.1%
2008-03-25-9.1%-10.7%-10.5%
2008-02-26-7.7%-9.1%-9.9%
2008-01-01-7.70%-7.7%
2007-12-01-6.10%-7.70%
2007-11-01-4.90%-6.10%
2007-10-01-4.30%-4.90%
2007-09-01-3.80%-4.30%
2007-08-01-3.40%-3.80%
2007-07-01-2.80%-3.40%
2007-06-01-2.10%-2.80%
2007-05-01-1.30%-2.10%
2007-04-01-0.80%-1.30%
2007-03-01-0.10%-0.80%
2007-02-010.70%-0.10%
2007-01-011.80%0.70%
2006-12-013.00%1.80%
2006-11-014.30%3.00%
2006-10-015.70%4.30%
2006-09-017.20%5.70%
2006-08-018.60%7.20%
2006-07-0110.00%8.60%
2006-06-0111.20%10.00%
2006-05-0112.30%11.20%
2006-04-0113.80%12.30%
2006-03-0114.70%13.80%
2006-02-0115.50%14.70%
2006-01-0115.70%15.50%
2005-12-0115.70%15.70%
2005-11-0115.40%15.70%
2005-10-0115.20%15.40%
2005-09-0115.10%15.20%
2005-08-0115.30%15.10%
2005-07-0115.80%15.30%
2005-06-0116.30%15.80%
2005-05-0116.60%16.30%
2005-04-0116.60%16.60%
2005-03-0116.30%16.60%
2005-02-0116.20%16.30%
2005-01-0116.40%16.20%
2004-12-0116.60%16.40%
2004-11-0116.90%16.60%
2004-10-0117.10%16.90%
2004-09-0117.10%17.10%
2004-08-0116.60%17.10%
2004-07-0115.40%16.60%
2004-06-0114.40%15.40%
2004-05-0113.30%14.40%
2004-04-0112.40%13.30%
2004-03-0111.80%12.40%
2004-02-0111.40%11.80%
2004-01-0111.00%11.40%
2003-12-0110.70%11.00%
2003-11-0110.50%10.70%
2003-10-0110.20%10.50%
2003-09-0110.30%10.20%
2003-08-0110.60%10.30%
2003-07-0111.30%10.60%
2003-06-0111.80%11.30%
2003-05-0112.20%11.80%
2003-04-0112.50%12.20%
2003-03-0112.40%12.50%
2003-02-0112.20%12.40%
2003-01-0111.50%12.20%
2002-12-0111.00%11.50%
2002-11-0110.50%11.00%
2002-10-0110.20%10.50%
2002-09-019.70%10.20%
2002-08-019.00%9.70%
2002-07-018.30%9.00%
2002-06-017.50%8.30%
2002-05-017.10%7.50%
2002-04-017.10%7.10%
2002-03-017.30%7.10%
2002-02-017.90%7.30%
2002-01-018.80%7.90%
2001-12-019.30%8.80%
2001-11-019.60%9.30%
2001-10-019.60%9.60%
2001-09-019.70%9.60%
2001-08-019.90%9.70%
2001-07-0110.50%9.90%
2001-06-0111.40%10.50%
2001-05-0112.00%11.40%
2001-04-0112.20%12.00%
2001-03-0112.40%12.20%
2001-02-01012.40%
14:00
S&P/CS HPI Composite - 20 n.s.a. (MoM) (Sep) -0,6%   -0,5%
OpisThe Case-Shiller index prices are measured monthly and tracks repeat sales of houses using a modified version of the weighted-repeat sales methodology proposed by Karl Case and Robert Shiller and Allan Weiss. This means that, to a large extent, it is able to adjust for the quality of the homes sold, unlike simple averages. As a monthly tracking index, Case-Shiller Index has long lag time. Typically, it takes about 2 months for S&P to publish the results, as opposed to 1 month for most other monthly indices and indicators. A higher than expected number should be taken as positive to the USD, while a lower than expected number as negative.
Priorytet Średni
DataPoprzednia wartośćKolejna wartośćPrzewidywana wartość
2025-10-28-0.3%-0.6%
2025-09-300.0%-0.3%
2025-08-260.4%0.0%
2025-07-290.8%0.4%
2025-06-241.1%0.8%
2025-05-270.7%1.1%
2025-04-290.1%0.7%
2025-03-25-0.1%0.1%0.2%
2025-02-25-0.1%-0.1%
2025-01-28-0.2%-0.1%
2024-12-31-0.3%-0.2%
2024-11-26-0.3%-0.3%
2024-10-290.0%-0.3%
2024-09-240.6%0.0%
2024-08-271.0%0.6%
2024-07-301.4%1.0%
2024-06-251.6%1.4%
2024-05-280.9%1.6%
2024-04-30-0.1%0.9%
2024-03-26-0.3%-0.1%
2024-02-27-0.2%-0.3%
2024-01-300.1%-0.2%
2023-12-260.2%0.1%
2023-11-280.3%0.2%
2023-10-310.6%0.3%
2023-09-260.9%0.6%
2023-08-291.5%0.9%0.6%
2023-07-251.7%1.5%1.2%
2023-06-271.6%1.7%1.5%
2023-05-300.3%1.6%0.4%
2023-04-25-0.6%0.3%-0.7%
2023-03-28-0.9%-0.6%
2023-02-28-0.8%-0.9%
2023-01-31-0.8%-0.8%
2022-12-27-1.5%-0.8%
2022-11-29-1.6%-1.5%-0.7%
2022-10-25-0.8%-1.6%-0.7%
2022-09-270.4%-0.8%
2022-08-301.5%0.4%
2022-07-262.2%1.5%
2022-06-283.1%2.2%
2022-05-312.4%3.1%
2022-04-261.4%2.4%
2022-03-291.1%1.4%
2022-02-221.0%1.1%
2022-01-250.8%1.0%
2021-12-280.8%0.8%
2021-11-300.9%0.8%1.5%
2021-10-261.5%0.9%1.5%
2021-09-282.0%1.5%
2021-08-312.1%2.0%
2021-07-272.2%2.1%
2021-06-292.2%2.2%
2021-05-251.3%2.2%
2021-04-270.9%1.3%
2021-03-300.9%0.9%
2021-02-231.1%0.9%
2021-01-261.3%1.1%
2020-12-291.3%1.3%
2020-11-241.2%1.3%0.5%
2020-10-270.8%1.2%0.5%
2020-09-290.3%0.8%
2020-08-250.3%0.3%
2020-07-280.8%0.3%
2020-06-301.1%0.8%
2020-05-260.5%1.1%
2020-04-280.0%0.5%
2020-03-310.1%0.0%
2020-02-250.1%0.1%
2020-01-280.1%0.1%
2019-12-310.1%0.1%
2019-11-260.0%0.1%
2019-10-290.2%0.0%0.3%
2019-09-240.4%0.2%0.3%
2019-08-270.6%0.4%
2019-07-300.8%0.6%0.6%
2019-06-250.7%0.8%0.6%
2019-05-280.2%0.7%
2019-04-30-0.2%0.2%0.0%
2019-03-26-0.2%-0.2%
2019-02-26-0.1%-0.2%
2019-01-290.0%-0.1%-0.1%
2018-12-260.0%0.0%-0.1%
2018-11-270.3%0.0%0.4%
2018-10-300.3%0.3%0.4%
2018-09-250.6%0.3%0.5%
2018-08-280.8%0.6%
2018-07-310.9%0.8%
2018-06-261.0%0.9%
2018-05-290.7%1.0%
2018-04-240.3%0.7%
2018-03-270.2%0.3%
2018-02-270.2%0.2%
2018-01-300.2%0.2%0.4%
2017-12-260.4%0.2%0.4%
2017-11-280.4%0.4%
2017-10-310.7%0.4%0.5%
2017-09-260.7%0.7%0.7%
2017-08-290.9%0.7%0.8%
2017-07-251.0%0.9%
2017-06-271.0%1.0%0.9%
2017-05-300.4%1.0%
2017-04-250.2%0.4%
2017-03-280.3%0.2%
2017-02-280.2%0.3%
2017-01-310.1%0.2%0.2%
2016-12-270.1%0.1%
2016-11-290.4%0.1%0.4%
2016-10-250.6%0.4%0.4%
2016-09-270.8%0.6%
2016-08-300.9%0.8%
2016-07-261.1%0.9%1.1%
2016-06-281.0%1.1%
2016-05-310.2%1.0%0.5%
2016-04-260.0%0.2%0.1%
2016-03-290.0%0.0%0.1%
2016-02-230.1%0.0%0.1%
2016-01-260.1%0.1%0.1%
2015-12-290.2%0.1%0.2%
2015-11-240.3%0.2%0.4%
2015-10-270.6%0.3%0.3%
2015-09-290.9%0.6%0.8%
2015-08-251.1%0.9%
2015-07-281.1%1.1%1.3%
2015-06-300.9%1.1%1.1%
2015-05-260.5%0.9%0.7%
2015-04-28-0.1%0.5%0.2%
2015-03-310.1%-0.1%0.1%
2015-02-24-0.2%0.1%-0.2%
2015-01-27-0.1%-0.2%-0.2%
2014-12-30-0.1%-0.1%-0.1%
2014-11-250.2%-0.1%0.0%
2014-10-280.6%0.2%0.5%
2014-09-301.0%0.6%1.1%
2014-08-261.2%1.0%1.0%
2014-07-291.1%1.2%1.5%
2014-06-240.9%1.1%0.8%
2014-05-270.0%0.9%0.2%
2014-04-29-0.1%0.0%0.0%
2014-03-25-0.1%-0.1%-0.1%
2014-02-25-0.1%-0.1%-0.1%
2014-01-280.2%-0.1%0.2%
2013-12-310.7%0.2%0.7%
2013-11-261.3%0.7%0.7%
2013-10-291.8%1.3%0.8%
2013-09-242.2%1.8%2.0%
2013-08-272.5%2.2%2.3%
2013-07-302.6%2.5%2.3%
2013-06-251.4%2.6%1.1%
2013-05-280.3%1.4%0.7%
2013-04-010.20%0.3%
2013-03-010.00%0.20%
2013-02-010.20%0.00%
2013-01-01-0.20%0.20%
2012-12-01-0.10%-0.20%
2012-11-010.30%-0.10%
2012-10-010.90%0.30%
2012-09-011.60%0.90%
2012-08-012.30%1.60%
2012-07-012.40%2.30%
2012-06-011.40%2.40%
2012-05-010.00%1.40%
2012-04-01-0.80%0.00%
2012-03-01-1.00%-0.80%
2012-02-01-1.10%-1.00%
2012-01-01-1.30%-1.10%
2011-12-01-1.40%-1.30%
2011-11-01-0.70%-1.40%
2011-10-010.10%-0.70%
2011-09-011.00%0.10%
2011-08-011.20%1.00%
2011-07-011.00%1.20%
2011-06-010.60%1.00%
2011-05-01-1.00%0.60%
2011-04-01-1.20%-1.00%
2011-03-01-1.10%-1.20%
2011-02-01-1.00%-1.10%
2011-01-01-1.00%-1.00%
2010-12-01-1.40%-1.00%
2010-11-01-0.80%-1.40%
2010-10-01-0.30%-0.80%
2010-09-010.60%-0.30%
2010-08-011.00%0.60%
2010-07-011.30%1.00%
2010-06-010.90%1.30%
2010-05-01-0.50%0.90%
2010-04-01-0.90%-0.50%
2010-03-01-0.40%-0.90%
2010-02-01-0.20%-0.40%
2010-01-01-0.20%-0.20%
2009-12-01-0.10%-0.20%
2009-11-010.40%-0.10%
2009-10-011.20%0.40%
2009-09-011.70%1.20%
2009-08-011.40%1.70%
2009-07-010.50%1.40%
2009-06-01-0.60%0.50%
2009-05-01-2.10%-0.60%
2009-04-01-2.20%-2.10%
2009-03-01-2.80%-2.20%
2009-02-01-2.60%-2.80%
2009-01-01-2.30%-2.60%
2008-12-01-2.20%-2.30%
2008-11-01-1.80%-2.20%
2008-10-01-1.00%-1.80%
2008-09-01-0.80%-1.00%
2008-08-01-0.50%-0.80%
2008-07-01-0.80%-0.50%
2008-06-01-1.30%-0.80%
2008-05-01-2.10%-1.30%
2008-04-01-2.60%-2.10%
2008-03-01-2.30%-2.60%
2008-02-01-2.10%-2.30%
2008-01-01-2.10%-2.10%
2007-12-01-1.40%-2.10%
2007-11-01-0.90%-1.40%
2007-10-01-0.70%-0.90%
2007-09-01-0.40%-0.70%
2007-08-01-0.30%-0.40%
2007-07-01-0.20%-0.30%
2007-06-01-0.20%-0.20%
2007-05-01-0.30%-0.20%
2007-04-01-0.40%-0.30%
2007-03-01-0.50%-0.40%
2007-02-01-0.60%-0.50%
2007-01-01-0.40%-0.60%
2006-12-01-0.20%-0.40%
2006-11-01-0.20%-0.20%
2006-10-01-0.20%-0.20%
2006-09-010.10%-0.20%
2006-08-010.30%0.10%
2006-07-010.50%0.30%
2006-06-010.60%0.50%
2006-05-010.20%0.60%
2006-04-010.40%0.20%
2006-03-010.20%0.40%
2006-02-010.50%0.20%
2006-01-010.80%0.50%
2005-12-011.00%0.80%
2005-11-011.20%1.00%
2005-10-011.20%1.20%
2005-09-011.40%1.20%
2005-08-011.50%1.40%
2005-07-011.60%1.50%
2005-06-011.60%1.60%
2005-05-011.60%1.60%
2005-04-011.20%1.60%
2005-03-010.90%1.20%
2005-02-010.70%0.90%
2005-01-010.70%0.70%
2004-12-010.80%0.70%
2004-11-011.00%0.80%
2004-10-011.10%1.00%
2004-09-011.60%1.10%
2004-08-012.00%1.60%
2004-07-012.00%2.00%
2004-06-011.90%2.00%
2004-05-011.60%1.90%
2004-04-010.90%1.60%
2004-03-010.80%0.90%
2004-02-010.90%0.80%
2004-01-010.90%0.90%
2003-12-011.10%0.90%
2003-11-011.20%1.10%
2003-10-011.10%1.20%
2003-09-011.10%1.10%
2003-08-010.90%1.10%
2003-07-011.10%0.90%
2003-06-011.00%1.10%
2003-05-010.70%1.00%
2003-04-010.40%0.70%
2003-03-010.40%0.40%
2003-02-010.60%0.40%
2003-01-010.60%0.60%
2002-12-010.80%0.60%
2002-11-010.90%0.80%
2002-10-011.20%0.90%
2002-09-011.40%1.20%
2002-08-011.60%1.40%
2002-07-011.60%1.60%
2002-06-011.30%1.60%
2002-05-011.00%1.30%
2002-04-010.30%1.00%
2002-03-010.20%0.30%
2002-02-01-0.10%0.20%
2002-01-010.20%-0.10%
2001-12-010.40%0.20%
2001-11-010.60%0.40%
2001-10-010.80%0.60%
2001-09-010.80%0.80%
2001-08-010.90%0.80%
2001-07-010.80%0.90%
2001-06-011.00%0.80%
2001-05-010.90%1.00%
2001-04-010.60%0.90%
2001-03-010.70%0.60%
2001-02-010.70%0.70%
2001-01-010.70%0.70%
2000-12-010.60%0.70%
2000-11-010.70%0.60%
15:00
CB Consumer Confidence (Nov) 95,5 93,5 88,7
OpisConference Board (CB) Consumer Confidence measures the level of consumer confidence in economic activity. It is a leading indicator as it can predict consumer spending, which plays a major role in overall economic activity. Higher readings point to higher consumer optimism. A higher than expected reading should be taken as positive/bullish for the USD, while a lower than expected reading should be taken as negative/bearish for the USD.
PriorytetWysoki
DataPoprzednia wartośćKolejna wartośćPrzewidywana wartość
2025-10-2895.694.693.4
2025-09-3097.895.696.0
2025-08-2698.797.896.4
2025-07-2995.298.795.9
2025-06-2498.495.299.4
2025-05-2785.798.487.1
2025-04-2993.985.787.7
2025-03-25100.193.994.2
2025-02-25105.3100.1102.7
2025-01-28109.5105.3105.7
2024-12-23112.8109.5112.9
2024-11-26109.6112.8111.8
2024-10-2999.2109.699.5
2024-09-24105.699.2103.9
2024-08-27101.9105.6100.9
2024-07-3097.8101.999.7
2024-06-25101.397.8100.0
2024-05-2897.5101.396.0
2024-04-30103.197.5104.0
2024-03-26104.8103.1106.9
2024-02-27110.9104.8114.8
2024-01-30108.0110.9114.2
2023-12-20101.0108.0103.8
2023-11-2899.1101.0101.0
2023-10-31104.399.1100.0
2023-09-26108.7104.3105.5
2023-08-29114.0108.7116.0
2023-07-25110.1114.0111.8
2023-06-27102.5110.1104.0
2023-05-30103.7102.599.0
2023-04-25104.0103.7104.0
2023-03-28103.4104.0101.0
2023-02-28106.0103.4108.5
2023-01-31109.0106.0109.0
2022-12-21101.4109.0101.0
2022-11-29102.2101.4100.0
2022-10-25107.8102.2106.5
2022-09-27103.6107.8104.5
2022-08-3095.3103.697.9
2022-07-2698.495.397.2
2022-06-28103.298.4100.4
2022-05-31108.6103.2103.9
2022-04-26107.6108.6108.0
2022-03-29105.7107.6107.0
2022-02-22111.1105.7110.0
2022-01-25115.2111.1111.8
2021-12-22111.9115.2110.8
2021-11-30111.6111.9111.0
2021-10-26109.8111.6108.3
2021-09-28115.2109.8114.5
2021-08-31125.1115.2124.0
2021-07-27128.9125.1123.9
2021-06-29120.0128.9119.0
2021-05-25117.5120.0119.2
2021-04-27109.0117.5113.0
2021-03-3090.4109.096.9
2021-02-2388.990.490.0
2021-01-2687.188.989.0
2020-12-2292.987.197.0
2020-11-24101.492.998.0
2020-10-27101.3101.4102.0
2020-09-2986.3101.389.2
2020-08-2591.786.393.0
2020-07-2898.391.794.5
2020-06-3085.998.391.8
2020-05-2685.785.988.0
2020-04-28118.885.787.9
2020-03-31132.6118.8110.0
2020-02-25130.4132.6132.0
2020-01-28128.2130.4128.0
2019-12-31126.8128.2128.2
2019-11-26126.1126.8127.0
2019-10-29126.3126.1128.0
2019-09-24134.2126.3134.1
2019-08-27135.8134.2129.5
2019-07-30124.3135.8125.0
2019-06-25131.3124.3131.1
2019-05-28129.2131.3130.1
2019-04-30124.1129.2126.0
2019-03-26131.4124.1132.0
2019-02-26121.7131.4124.7
2019-01-29126.6121.7124.7
2018-12-27136.4126.6133.7
2018-11-27137.9136.4135.9
2018-10-30135.3137.9136.0
2018-09-25134.7135.3132.2
2018-08-28127.9134.7126.7
2018-07-31127.1127.9126.5
2018-06-26128.8127.1127.6
2018-05-29125.6128.8128.2
2018-04-24127.0125.6126.0
2018-03-27130.0127.0131.0
2018-02-27124.3130.0126.2
2018-01-30123.1124.3123.1
2017-12-27128.6123.1128.0
2017-11-28126.2128.6124.0
2017-10-31120.6126.2121.0
2017-09-26120.4120.6120.0
2017-08-29120.0120.4120.3
2017-07-25117.3120.0116.5
2017-06-27117.6117.3116.0
2017-05-30119.4117.6119.8
2017-04-25124.9119.4122.5
2017-03-28116.1124.9114.0
2017-02-28111.6116.1111.0
2017-01-31113.3111.6113.0
2016-12-27109.4113.3109.0
2016-11-29100.8109.4101.2
2016-10-25103.5100.8101.0
2016-09-27101.8103.599.0
2016-08-3096.7101.897.0
2016-07-2697.496.795.9
2016-06-2892.497.493.3
2016-05-3194.792.496.0
2016-04-2696.194.796.0
2016-03-2994.096.194.0
2016-02-2397.894.097.0
2016-01-2696.397.896.5
2015-12-2992.696.393.8
2015-11-2499.192.699.5
2015-10-27102.699.1103.0
2015-09-29101.3102.696.1
2015-08-2591.0101.393.4
2015-07-2899.891.0100.0
2015-06-3094.699.897.3
2015-05-2694.394.694.9
2015-04-28101.494.3102.5
2015-03-3198.8101.496.0
2015-02-24103.898.899.6
2015-01-2793.1103.895.1
2014-12-3091.093.193.2
2014-11-2594.191.095.9
2014-10-2889.094.187.0
2014-09-3093.489.092.5
2014-08-2690.393.489.0
2014-07-2986.490.385.3
2014-06-2482.286.483.5
2014-05-2781.782.283.0
2014-04-2983.981.783.0
2014-03-2578.383.978.6
2014-02-2579.478.380.0
2014-01-2877.579.478.1
2013-12-3172.077.576.0
2013-11-2672.472.072.9
2013-10-2980.272.475.0
2013-09-2481.880.279.9
2013-08-2781.081.879.0
2013-07-3082.181.081.4
2013-06-2574.382.175.4
2013-05-2869.074.371.0
2013-04-3061.969.060.8
2013-03-2668.061.968.0
2013-02-2658.468.061.0
2013-01-2966.758.464.0
2012-12-2771.566.770.0
2012-11-2773.171.573.0
2012-11-0168.473.172.5
2012-09-2561.368.463.0
2012-08-2865.461.366.0
2012-07-3162.765.461.5
2012-06-2664.462.763.5
2012-05-2968.764.470.0
2012-04-2469.568.769.7
2012-03-2771.669.570.3
2012-02-2861.571.663.0
2012-01-3164.861.568.2
2011-12-2755.264.858.2
2011-11-2940.955.243.0
2011-10-2546.440.946.0
2011-09-2745.246.446.5
2011-08-3059.245.252.2
2011-07-2657.659.256.0
2011-06-2861.757.660.3
2011-05-3166.061.766.3
2011-04-2663.866.064.4
2011-03-2972.063.865.0
2011-02-2264.872.065.1
2011-01-2553.364.853.5
2010-12-2854.353.356.1
2010-11-3049.954.352.0
2010-10-2648.649.949.0
2010-09-2853.248.652.9
2010-08-3151.053.250.0
2010-07-2754.351.051.0
2010-06-2962.754.362.0
2010-05-2557.762.758.3
2010-04-2752.357.753.7
2010-03-3046.452.350.0
2010-02-2356.546.455.0
2010-01-2653.656.553.5
2009-12-2950.653.653.0
2009-11-2448.750.647.7
2009-10-2753.448.753.4
2009-09-2954.553.457.0
2009-08-2547.454.548.1
2009-07-2849.347.449.0
2009-06-3054.849.355.8
2009-05-2640.854.842.1
2009-04-2826.940.829.6
2009-03-3125.026.927.8
2009-02-2437.725.035.5
2009-01-2738.037.738.7
2008-12-3044.938.045.5
2008-11-2538.044.938.0
2008-10-2859.838.052.2
2008-09-3056.959.854.6
2008-08-2651.956.953.0
2008-07-2950.451.950.0
2008-06-2457.250.456.4
2008-05-2762.357.260.0
2008-04-2964.562.361.5
2008-03-2575.064.573.5
2008-02-2687.975.082.0
2008-01-0187.8087.9
2007-12-0195.2087.80
2007-11-0199.5095.20
2007-10-01105.6099.50
2007-09-01111.90105.60
2007-08-01105.30111.90
2007-07-01108.50105.30
2007-06-01106.30108.50
2007-05-01108.20106.30
2007-04-01111.20108.20
2007-03-01110.20111.20
2007-02-01110.00110.20
2007-01-01105.30110.00
2006-12-01105.10105.30
2006-11-01105.90105.10
2006-10-01100.20105.90
2006-09-01107.00100.20
2006-08-01105.40107.00
2006-07-01104.70105.40
2006-06-01109.80104.70
2006-05-01107.50109.80
2006-04-01102.70107.50
2006-03-01106.80102.70
2006-02-01103.80106.80
2006-01-0198.30103.80
2005-12-0185.2098.30
2005-11-0187.5085.20
2005-10-01105.5087.50
2005-09-01103.60105.50
2005-08-01106.20103.60
2005-07-01103.10106.20
2005-06-0197.50103.10
2005-05-01103.0097.50
2005-04-01104.40103.00
2005-03-01105.10104.40
2005-02-01102.70105.10
2005-01-0192.60102.70
2004-12-0192.9092.60
2004-11-0196.7092.90
2004-10-0198.7096.70
2004-09-01105.7098.70
2004-08-01102.80105.70
2004-07-0193.10102.80
2004-06-0193.0093.10
2004-05-0188.5093.00
2004-04-0188.5088.50
2004-03-0197.7088.50
2004-02-0194.8097.70
2004-01-0192.5094.80
2003-12-0181.7092.50
2003-11-0177.0081.70
2003-10-0181.7077.00
2003-09-0177.0081.70
2003-08-0183.5077.00
2003-07-0183.6083.50
2003-06-0181.0083.60
2003-05-0161.4081.00
2003-04-0164.8061.40
2003-03-0178.8064.80
2003-02-0180.7078.80
2003-01-0184.9080.70
2002-12-0179.6084.90
2002-11-0193.7079.60
2002-10-0194.5093.70
2002-09-0197.4094.50
2002-08-01106.3097.40
2002-07-01110.30106.30
2002-06-01108.50110.30
2002-05-01110.70108.50
2002-04-0195.00110.70
2002-03-0197.8095.00
2002-02-0194.6097.80
2002-01-0184.9094.60
2001-12-0185.3084.90
2001-11-0197.0085.30
2001-10-01114.0097.00
2001-09-01116.30114.00
2001-08-01118.90116.30
2001-07-01116.10118.90
2001-06-01109.90116.10
2001-05-01116.90109.90
2001-04-01109.20116.90
2001-03-01115.70109.20
2001-02-01128.60115.70
2001-01-01132.60128.60
2000-12-01135.80132.60
2000-11-01142.50135.80
15:00
Pending Home Sales (MoM) (Oct) 0,1% 0,5% 1,9%
OpisThe National Association of Realtors (NAR) Pending Home Sales Report measures the change in the number of homes under contract to be sold but still awaiting the closing transaction, excluding new construction.A higher than expected reading should be taken as positive/bullish for the USD, while a lower than expected reading should be taken as negative/bearish for the USD.
Priorytet Średni
DataPoprzednia wartośćKolejna wartośćPrzewidywana wartość
2025-10-294.2%0.0%1.6%
2025-09-29-0.3%4.2%0.2%
2025-08-28-0.8%-0.3%-0.4%
2025-07-301.8%-0.8%0.2%
2025-06-26-6.3%1.8%0.2%
2025-05-295.5%-6.3%-0.9%
2025-04-302.1%5.5%0.9%
2025-03-27-4.6%2.1%0.9%
2025-02-27-4.1%-4.6%-0.9%
2025-01-301.6%-4.1%0.0%
2024-12-301.8%1.6%0.9%
2024-11-277.5%1.8%-2.1%
2024-10-300.6%7.5%1.9%
2024-09-26-5.5%0.6%0.9%
2024-08-294.8%-5.5%0.2%
2024-07-31-1.9%4.8%1.4%
2024-06-27-7.7%-1.9%0.6%
2024-05-303.6%-7.7%-1.1%
2024-04-251.6%3.6%0.3%
2024-03-28-4.7%1.6%1.4%
2024-02-295.7%-4.7%1.4%
2024-01-260.0%5.7%1.5%
2023-12-28-1.2%0.0%1.0%
2023-11-301.0%-1.2%-2.0%
2023-10-26-7.1%1.0%-1.8%
2023-09-280.5%-7.1%-0.8%
2023-08-300.4%0.5%-0.6%
2023-07-27-2.5%0.4%-0.5%
2023-06-29-0.4%-2.5%-0.5%
2023-05-25-5.2%-0.4%0.5%
2023-04-270.8%-5.2%0.5%
2023-03-298.1%0.8%-2.3%
2023-02-271.1%8.1%1.0%
2023-01-27-2.6%1.1%-0.9%
2022-12-28-4.6%-2.6%-0.8%
2022-11-30-8.7%-4.6%-5.0%
2022-10-28-1.9%-8.7%-5.0%
2022-09-28-0.6%-1.9%-1.4%
2022-08-24-8.9%-0.6%-4.0%
2022-07-270.4%-8.9%-1.5%
2022-06-27-4.0%0.4%-3.7%
2022-05-26-1.6%-4.0%-2.0%
2022-04-27-4.0%-1.6%-1.6%
2022-03-25-5.8%-4.0%1.0%
2022-02-25-2.3%-5.8%1.0%
2022-01-27-2.3%-2.3%-0.2%
2021-12-297.5%-2.3%0.5%
2021-11-29-2.4%7.5%0.9%
2021-10-288.1%-2.4%0.5%
2021-09-29-2.0%8.1%1.4%
2021-08-30-2.0%-2.0%0.4%
2021-07-298.3%-2.0%0.3%
2021-06-30-4.4%8.3%-0.8%
2021-05-271.7%-4.4%0.8%
2021-04-29-11.5%1.7%5.0%
2021-03-31-2.4%-11.5%-2.6%
2021-02-250.5%-2.4%-0.2%
2021-01-29-2.5%0.5%-0.1%
2020-12-30-0.9%-2.5%0.2%
2020-11-30-2.0%-0.9%1.0%
2020-10-298.8%-2.0%3.4%
2020-09-305.9%8.8%3.2%
2020-08-2715.8%5.9%3.0%
2020-07-2944.3%15.8%15.0%
2020-06-29-21.8%44.3%18.9%
2020-05-28-20.8%-21.8%-15.0%
2020-04-292.3%-20.8%-10.0%
2020-03-305.3%2.3%-1.0%
2020-02-27-4.3%5.3%2.2%
2020-01-291.2%-4.3%0.5%
2019-12-30-1.3%1.2%1.2%
2019-11-271.4%-1.3%0.2%
2019-10-291.4%1.4%0.9%
2019-09-26-2.5%1.4%0.9%
2019-08-292.8%-2.5%0.1%
2019-07-301.1%2.8%0.5%
2019-06-27-1.5%1.1%1.1%
2019-05-303.9%-1.5%0.9%
2019-04-30-1.0%3.9%1.1%
2019-03-284.3%-1.0%0.1%
2019-02-27-2.3%4.3%0.8%
2019-01-30-0.9%-2.3%0.8%
2018-12-28-2.6%-0.9%0.7%
2018-11-290.7%-2.6%0.8%
2018-10-25-1.9%0.7%-0.1%
2018-09-27-0.8%-1.9%-0.2%
2018-08-291.0%-0.8%0.3%
2018-07-30-0.5%1.0%0.4%
2018-06-27-1.3%-0.5%1.1%
2018-05-310.6%-1.3%0.4%
2018-04-302.8%0.6%0.6%
2018-03-28-5.0%2.8%2.1%
2018-02-280.0%-5.0%0.4%
2018-01-310.3%0.0%0.5%
2017-12-273.5%0.3%-0.4%
2017-11-29-0.4%3.5%1.0%
2017-10-26-2.8%-0.4%0.2%
2017-09-27-0.8%-2.8%-0.5%
2017-08-311.3%-0.8%0.5%
2017-07-31-0.7%1.3%0.7%
2017-06-28-1.7%-0.7%0.8%
2017-05-31-0.9%-1.7%0.5%
2017-04-275.5%-0.9%-1.0%
2017-03-29-2.8%5.5%2.4%
2017-02-270.8%-2.8%0.8%
2017-01-30-2.5%0.8%1.1%
2016-12-280.1%-2.5%0.5%
2016-11-301.4%0.1%0.2%
2016-10-27-2.5%1.4%1.2%
2016-09-291.2%-2.5%0.3%
2016-08-31-0.8%1.2%0.6%
2016-07-27-3.7%-0.8%1.4%
2016-06-293.9%-3.7%-1.1%
2016-05-261.6%3.9%0.6%
2016-04-273.4%1.6%0.5%
2016-03-28-3.0%3.4%1.0%
2016-02-290.9%-3.0%0.5%
2016-01-28-1.1%0.9%0.8%
2015-12-300.4%-1.1%0.5%
2015-11-30-1.6%0.4%1.5%
2015-10-29-1.4%-1.6%1.0%
2015-09-280.5%-1.4%0.4%
2015-08-27-1.7%0.5%1.0%
2015-07-290.6%-1.7%1.0%
2015-06-292.7%0.6%1.2%
2015-05-281.2%2.7%0.9%
2015-04-293.6%1.2%1.0%
2015-03-301.2%3.6%0.4%
2015-02-27-1.5%1.2%2.0%
2015-01-290.6%-1.5%0.5%
2014-12-31-1.1%0.6%0.6%
2014-11-260.6%-1.1%0.9%
2014-10-27-1.0%0.6%0.5%
2014-09-293.2%-1.0%-0.1%
2014-08-28-1.3%3.2%0.5%
2014-07-286.0%-1.3%0.5%
2014-06-300.5%6.0%1.5%
2014-05-293.4%0.5%1.0%
2014-04-28-0.5%3.4%1.0%
2014-03-27-0.2%-0.5%0.3%
2014-02-28-5.8%-0.2%2.0%
2014-01-30-0.3%-5.8%0.3%
2013-12-30-1.2%-0.3%1.0%
2013-11-25-4.6%-1.2%1.3%
2013-10-28-1.6%-4.6%0.1%
2013-09-26-1.4%-1.6%-1.0%
2013-08-28-0.4%-1.4%-0.5%
2013-07-295.8%-0.4%-1.0%
2013-06-27-0.5%5.8%1.0%
2013-05-301.5%-0.5%1.1%
2013-04-29-1.0%1.5%1.0%
2013-03-273.8%-1.0%-0.2%
2013-02-27-1.9%3.8%1.5%
2013-01-281.6%-1.9%0.3%
2012-12-285.0%1.6%1.0%
2012-11-290.4%5.0%0.8%
2012-10-25-2.6%0.4%2.1%
2012-09-272.6%-2.6%-0.7%
2012-08-29-1.4%2.6%1.0%
2012-07-265.4%-1.4%0.2%
2012-06-27-5.5%5.4%1.0%
2012-05-303.8%-5.5%0.1%
2012-04-260.4%3.8%1.0%
2012-03-262.0%0.4%1.0%
2012-02-27-1.9%2.0%1.0%
2012-01-257.3%-1.9%-1.0%
2011-12-2910.4%7.3%1.5%
2011-11-30-4.6%10.4%1.2%
2011-10-27-1.2%-4.6%0.2%
2011-09-29-1.3%-1.2%-2.1%
2011-08-292.4%-1.3%-1.0%
2011-07-288.2%2.4%-2.0%
2011-06-29-11.3%8.2%2.4%
2011-05-273.5%-11.3%-1.0%
2011-04-280.7%3.5%1.5%
2011-03-28-2.8%0.7%0.3%
2011-02-28-3.2%-2.8%-2.5%
2011-01-273.1%-3.2%0.8%
2010-12-3010.1%3.1%2.1%
2010-12-02-1.8%10.1%-0.9%
2010-11-054.4%-1.8%0.5%
2010-10-044.5%4.4%2.8%
2010-09-02-2.8%4.5%0.0%
2010-08-03-29.9%-2.8%-5.0%
2010-07-016.0%-29.9%-12.5%
2010-06-027.1%6.0%3.5%
2010-05-048.3%7.1%5.0%
2010-04-05-7.8%8.3%0.0%
2010-03-040.8%-7.8%1.7%
2010-02-02-16.4%0.8%1.0%
2010-01-053.9%-16.4%-2.8%
2009-12-016.0%3.9%-0.5%
2009-11-026.4%6.0%0.4%
2009-10-013.2%6.4%1.0%
2009-09-013.6%3.2%1.8%
2009-08-040.8%3.6%0.8%
2009-07-017.1%0.8%1.7%
2009-06-023.2%7.1%0.5%
2009-05-042.0%3.2%0.1%
2009-04-01-7.7%2.0%0.3%
2009-03-036.3%-7.7%-3.0%
2009-02-03-4.0%6.3%0.0%
2009-01-06-0.7%-4.0%-0.8%
2008-12-09-4.6%-0.7%-3.2%
2008-11-077.4%-4.6%-3.4%
2008-10-08-3.2%7.4%-1.5%
2008-09-095.3%-3.2%-1.2%
2008-08-07-4.7%5.3%-1.0%
2008-07-086.3%-4.7%-2.4%
2008-06-09-1.0%6.3%-0.5%
2008-05-07-1.9%-1.0%-1.0%
2008-04-080.0%-1.9%-0.8%
2008-03-06-1.5%0.0%-1.0%
2008-02-01-2.40%-1.5%
2008-01-01-0.80%-2.40%
2007-12-012.40%-0.80%
2007-11-012.00%2.40%
2007-10-01-8.30%2.00%
2007-09-01-7.30%-8.30%
2007-08-011.30%-7.30%
2007-07-01-2.10%1.30%
2007-06-01-3.50%-2.10%
2007-05-01-3.10%-3.50%
2007-04-010.70%-3.10%
2007-03-01-4.50%0.70%
2007-02-012.80%-4.50%
2007-01-012.20%2.80%
2006-12-01-0.80%2.20%
2006-11-01-1.10%-0.80%
2006-10-01-0.20%-1.10%
2006-09-01-1.90%-0.20%
2006-08-01-1.20%-1.90%
2006-07-01-1.10%-1.20%
2006-06-01-1.50%-1.10%
2006-05-01-1.70%-1.50%
2006-04-01-0.70%-1.70%
2006-03-010.10%-0.70%
2006-02-01-2.00%0.10%
2006-01-01-2.00%-2.00%
2005-12-01-2.00%-2.00%
2005-11-01-0.60%-2.00%
2005-10-01-0.60%-0.60%
2005-09-011.00%-0.60%
2005-08-010.30%1.00%
2005-07-01-1.20%0.30%
2005-06-012.60%-1.20%
2005-05-01-0.40%2.60%
2005-04-011.70%-0.40%
2005-03-01-1.50%1.70%
2005-02-010.30%-1.50%
2005-01-01-1.50%0.30%
2004-12-011.20%-1.50%
2004-11-011.80%1.20%
2004-10-010.70%1.80%
2004-09-011.20%0.70%
2004-08-01-1.80%1.20%
2004-07-013.60%-1.80%
2004-06-01-2.70%3.60%
2004-05-015.80%-2.70%
2004-04-012.70%5.80%
2004-03-012.00%2.70%
2004-02-01-1.10%2.00%
2004-01-010.00%-1.10%
2003-12-012.10%0.00%
2003-11-010.30%2.10%
2003-10-01-5.40%0.30%
2003-09-012.50%-5.40%
2003-08-014.70%2.50%
2003-07-010.30%4.70%
2003-06-011.50%0.30%
2003-05-014.60%1.50%
2003-04-01-5.80%4.60%
2003-03-012.20%-5.80%
2003-02-01-0.70%2.20%
2003-01-012.90%-0.70%
2002-12-01-1.80%2.90%
2002-11-011.10%-1.80%
2002-10-011.20%1.10%
2002-09-011.80%1.20%
2002-08-01-0.70%1.80%
2002-07-01-3.70%-0.70%
2002-06-01-0.10%-3.70%
2002-05-01-2.50%-0.10%
2002-04-01-0.30%-2.50%
2002-03-01-2.10%-0.30%
2002-02-016.10%-2.10%
2002-01-014.50%6.10%
2001-12-019.10%4.50%
2001-11-01-7.90%9.10%
2001-10-01-0.30%-7.90%
2001-09-01-0.20%-0.30%
2001-08-01-3.40%-0.20%
2001-07-012.70%-3.40%
2001-06-01-2.90%2.70%
2001-05-01-4.70%-2.90%
2001-04-015.10%-4.70%
2001-03-0105.10%
15:00
Pending Home Sales Index (Oct) 74,9   76,3
OpisThe National Association of Realtors (NAR) Pending Home Sales Report measures the change in the number of homes under contract to be sold but still awaiting the closing transaction, excluding new construction. A higher than expected number should be taken as positive to the USD, while a lower than expected number as negative.
PriorytetNiski
DataPoprzednia wartośćKolejna wartośćPrzewidywana wartość
2025-10-2974.874.8
2025-09-2971.874.8
2025-08-2872.071.8
2025-07-3072.672.0
2025-06-2671.372.6
2025-05-2976.171.3
2025-04-3072.176.1
2025-03-2770.672.1
2025-02-2774.070.6
2025-01-3078.574.0
2024-12-3077.378.5
2024-11-2775.977.3
2024-10-3070.675.9
2024-09-2670.270.6
2024-08-2974.370.2
2024-07-3170.974.3
2024-06-2772.370.9
2024-05-3078.372.3
2024-04-2575.678.3
2024-03-2874.475.6
2024-02-2978.174.4
2024-01-2671.478.1
2023-12-2871.671.4
2023-11-3072.571.6
2023-10-2671.872.5
2023-09-2877.371.8
2023-08-3076.977.3
2023-07-2776.676.9
2023-06-2978.676.6
2023-05-2578.978.6
2023-04-2783.278.9
2023-03-2982.583.2
2023-02-2776.382.5
2023-01-2775.076.3
2022-12-2877.075.0
2022-11-3080.877.0
2022-10-2888.580.8
2022-09-2890.288.5
2022-08-2490.790.2
2022-07-2799.690.7
2022-06-2799.299.6
2022-05-26103.399.2
2022-04-27105.0103.3
2022-03-25109.4105.0
2022-02-25116.1109.4
2022-01-27122.3116.1
2021-12-29125.2122.3
2021-11-29116.5125.2
2021-10-28119.4116.5
2021-09-29110.5119.4
2021-08-30112.7110.5
2021-07-29115.0112.7
2021-06-30106.2115.0
2021-05-27111.1106.2
2021-04-29109.2111.1
2021-03-31123.4109.2
2021-02-25126.4123.4
2021-01-29125.9126.4
2020-12-30129.1125.9
2020-11-30130.3129.1
2020-10-29132.9130.3
2020-09-30122.1132.9
2020-08-27115.3122.1
2020-07-2999.6115.3
2020-06-2969.099.6
2020-05-2888.269.0
2020-04-29111.488.2
2020-03-30108.9111.4
2020-02-27103.4108.9
2020-01-29108.5103.4
2019-12-30107.2108.5
2019-11-27108.6107.2
2019-10-29107.1108.6
2019-09-26105.6107.1
2019-08-29108.3105.6
2019-07-30105.4108.3
2019-06-27104.3105.4
2019-05-30105.9104.3
2019-04-30101.9105.9
2019-03-28102.9101.9
2019-02-2798.7102.9
2019-01-30101.298.7
2018-12-28102.1101.2
2018-11-29104.8102.1
2018-10-25104.1104.8
2018-09-27106.1104.1
2018-08-29107.0106.1
2018-07-30105.9107.0
2018-06-27106.4105.9
2018-05-31107.8106.4
2018-04-30107.2107.8
2018-03-28104.3107.2
2018-02-28109.8104.3
2018-01-31109.6109.8
2017-12-27109.3109.6
2017-11-29105.6109.3
2017-10-26106.0105.6
2017-09-27109.1106.0
2017-08-31110.0109.1
2017-07-31108.6110.0
2017-06-28109.4108.6
2017-05-31111.3109.4
2017-04-27112.3111.3
2017-03-29106.4112.3
2017-02-27109.5106.4
2017-01-30107.3109.5
2016-12-28110.0107.3
2016-11-30109.9110.0
2016-10-27108.4109.9
2016-09-29111.2108.4
2016-08-31109.9111.2
2016-07-27110.8109.9
2016-06-29115.0110.8
2016-05-26110.7115.0
2016-04-27109.0110.7
2016-03-28105.4109.0
2016-02-29108.7105.4
2016-01-28106.7108.7
2015-12-30107.7106.7
2015-11-30107.5107.7
2015-10-29109.3107.5
2015-09-28110.9109.3
2015-08-27110.4110.9
2015-07-29112.3110.4
2015-06-29111.6112.3
2015-05-28108.7111.6
2015-04-29107.4108.7
2015-03-30103.7107.4
2015-02-27102.5103.7
2015-01-29104.6102.5
2014-12-31104.1104.6
2014-11-26105.3104.1
2014-10-27104.7105.3
2014-09-29105.8104.7
2014-08-28102.5105.8
2014-07-01101.90102.5
2014-06-0198.60101.90
2014-05-0197.7098.60
2014-04-0195.4097.70
2014-03-0196.1095.40
2014-02-0196.4096.10
2014-01-01100.1096.40
2013-12-01101.10100.10
2013-11-01102.80101.10
2013-10-01105.20102.80
2013-09-01106.00105.20
2013-08-01109.40106.00
2013-07-01108.00109.40
2013-06-01107.90108.00
2013-05-01106.10107.90
2013-04-01105.60106.10
2013-03-01104.90105.60
2013-02-01103.50104.90
2013-01-01102.90103.50
2012-12-01103.20102.90
2012-11-01102.00103.20
2012-10-01100.20102.00
2012-09-01100.30100.20
2012-08-0198.20100.30
2012-07-0197.8098.20
2012-06-0198.3097.80
2012-05-0198.6098.30
2012-04-0197.4098.60
2012-03-0197.0097.40
2012-02-0195.5097.00
2012-01-0194.1095.50
2011-12-0191.5094.10
2011-11-0188.6091.50
2011-10-0190.1088.60
2011-09-0190.1090.10
2011-08-0189.8090.10
2011-07-0187.7089.80
2011-06-0184.9087.70
2011-05-0187.8084.90
2011-04-0187.7087.80
2011-03-0189.0087.70
2011-02-0188.8089.00
2011-01-0188.3088.80
2010-12-0185.7088.30
2010-11-0181.3085.70
2010-10-0181.2081.30
2010-09-0180.6081.20
2010-08-0176.4080.60
2010-07-0178.1076.40
2010-06-01112.1078.10
2010-05-01100.80112.10
2010-04-0197.50100.80
2010-03-0193.3097.50
2010-02-0192.3093.30
2010-01-0195.2092.30
2009-12-01109.7095.20
2009-11-01106.00109.70
2009-10-01101.40106.00
2009-09-0199.40101.40
2009-08-0194.4099.40
2009-07-0192.6094.40
2009-06-0190.5092.60
2009-05-0183.2090.50
2009-04-0182.9083.20
2009-03-0183.2082.90
2009-02-0188.2083.20
2009-01-0180.2088.20
2008-12-0183.8080.20
2008-11-0190.7083.80
2008-10-0188.7090.70
2008-09-0187.4088.70
2008-08-0188.6087.40
2008-07-0185.1088.60
2008-06-0188.4085.10
2008-05-0182.8088.40
2008-04-0187.8082.80
2008-03-0186.1087.80
2008-02-0186.1086.10
2008-01-0188.2086.10
2007-12-0188.9088.20
2007-11-0186.8088.90
2007-10-0185.1086.80
2007-09-0192.8085.10
2007-08-01100.1092.80
2007-07-0198.80100.10
2007-06-01100.9098.80
2007-05-01104.60100.90
2007-04-01107.90104.60
2007-03-01107.10107.90
2007-02-01112.20107.10
2007-01-01109.10112.20
2006-12-01106.70109.10
2006-11-01107.60106.70
2006-10-01108.80107.60
2006-09-01109.00108.80
2006-08-01111.10109.00
2006-07-01112.50111.10
2006-06-01113.70112.50
2006-05-01115.40113.70
2006-04-01117.40115.40
2006-03-01118.20117.40
2006-02-01118.10118.20
2006-01-01120.50118.10
2005-12-01122.90120.50
2005-11-01125.40122.90
2005-10-01126.20125.40
2005-09-01127.00126.20
2005-08-01125.80127.00
2005-07-01125.40125.80
2005-06-01126.90125.40
2005-05-01123.70126.90
2005-04-01124.20123.70
2005-03-01122.10124.20
2005-02-01124.00122.10
2005-01-01123.60124.00
2004-12-01125.50123.60
2004-11-01124.00125.50
2004-10-01121.80124.00
2004-09-01120.90121.80
2004-08-01119.50120.90
2004-07-01121.70119.50
2004-06-01117.50121.70
2004-05-01120.70117.50
2004-04-01114.10120.70
2004-03-01111.10114.10
2004-02-01108.90111.10
2004-01-01110.10108.90
2003-12-01110.10110.10
2003-11-01107.80110.10
2003-10-01107.50107.80
2003-09-01113.60107.50
2003-08-01110.80113.60
2003-07-01105.80110.80
2003-06-01105.50105.80
2003-05-01103.90105.50
2003-04-0199.30103.90
2003-03-01105.4099.30
2003-02-01103.10105.40
2003-01-01103.80103.10
2002-12-01100.90103.80
2002-11-01102.80100.90
2002-10-01101.70102.80
2002-09-01100.50101.70
2002-08-0198.70100.50
2002-07-0199.4098.70
2002-06-01103.2099.40
2002-05-01103.30103.20
2002-04-01106.00103.30
2002-03-01106.30106.00
2002-02-01108.60106.30
2002-01-01102.40108.60
2001-12-0198.00102.40
2001-11-0189.8098.00
2001-10-0197.5089.80
2001-09-0197.8097.50
2001-08-0198.0097.80
2001-07-01101.4098.00
2001-06-0198.70101.40
2001-05-01101.7098.70
2001-04-01106.70101.70
2001-03-01101.50106.70
2001-02-010101.50
15:00
Richmond Manufacturing Index (Nov) -4 -5 -15
OpisThe Richmond Manufacturing Index rates the relative level of business conditions including shipments, new orders, and employment. A level above zero on the index indicates improving conditions; below indicates worsening conditions. The data is compiled from a survey of about 100 manufacturers in the Richmond area.A higher than expected reading should be taken as positive/bullish for the USD, while a lower than expected reading should be taken as negative/bearish for the USD.
PriorytetNiski
DataPoprzednia wartośćKolejna wartośćPrzewidywana wartość
2025-10-28-17-4-11
2025-09-23-7-17-5
2025-08-26-20-7-11
2025-07-22-8-20-2
2025-06-24-9-8-10
2025-05-28-13-9-9
2025-04-22-4-13-6
2025-03-256-48
2025-02-25-46-3
2025-01-28-10-4-13
2024-12-24-14-10-10
2024-11-26-14-14-10
2024-10-22-21-14-19
2024-09-24-19-21-13
2024-08-27-17-19-14
2024-07-23-10-17-7
2024-06-250-10-3
2024-05-29-70-6
2024-04-23-11-7-7
2024-03-26-5-11-5
2024-02-27-15-5-9
2024-01-23-11-15-7
2023-12-27-5-11-7
2023-11-283-51
2023-10-24533
2023-09-26-75-6
2023-08-22-9-7-7
2023-07-25-8-9-10
2023-06-27-15-8-10
2023-05-23-10-15-8
2023-04-25-5-10-9
2023-03-28-16-5-10
2023-02-28-11-16-6
2023-01-241-11-5
2022-12-28-91-10
2022-11-22-10-9-9
2022-10-25-8-10
2022-08-230-8-6
2022-07-26-90-17
2022-06-28-9-9
2022-05-2414-99
2022-04-261314
2022-03-221132
2022-02-2281
2022-01-2516814
2021-12-28121611
2021-11-231212
2021-10-26-312
2021-09-289-3
2021-08-2427925
2021-07-272627
2021-06-221826
2021-05-251718
2021-04-271717
2021-03-231417
2021-02-231414
2021-01-261914
2020-12-221519
2020-11-242915
2020-10-272129
2020-09-221821
2020-08-251018
2020-07-28-2710
2020-06-23-27-27
2020-05-27-53-27
2020-04-282-53
2020-03-24-22-9
2020-02-2520-213
2020-01-28-5209
2019-12-24-1-59
2019-11-268-16
2019-10-22-98-7
2019-09-241-92
2019-08-27-121-4
2019-07-232-125
2019-06-25527
2019-05-29356
2019-04-2310310
2019-03-26161012
2019-02-26-2168
2019-01-23-8-2-6
2018-12-2614-816
2018-11-28151416
2018-10-23291525
2018-09-25242922
2018-08-28202418
2018-07-24212018
2018-06-26162115
2018-05-22-3169
2018-04-2415-316
2018-03-27281523
2018-02-27142815
2018-01-23201419
2017-12-26302022
2017-11-28123014
2017-10-24191217
2017-09-26141913
2017-08-22141412
2017-07-257147
2017-06-27174
2017-05-2320115
2017-04-25222016
2017-03-28172216
2017-02-28121710
2017-01-248127
2016-12-27485
2016-11-22-441
2016-10-25-8-4-5
2016-09-27-11-8-2
2016-08-2310-116
2016-07-26-710-4
2016-06-28-1-72
2016-05-2414-19
2016-04-26221411
2016-03-22-422-1
2016-02-232-42
2016-01-26623
2015-12-22-36-1
2015-11-24-1-30
2015-10-27-5-1-3
2015-09-220-54
2015-08-251309
2015-07-286136
2015-06-23163
2015-05-26-310
2015-04-28-8-3-2
2015-03-240-82
2015-02-24607
2015-01-27766
2014-12-23478
2014-11-2520417
2014-10-28142011
2014-09-23121410
2014-08-267128
2014-07-22375
2014-06-24736
2014-05-27775
2014-04-22-770
2014-03-25-6-7-1
2014-02-2512-613
2014-01-28131213
2013-12-24131315
2013-11-261133
2013-10-22010
2013-09-2414017
2013-08-27-1114-7
2013-07-238-117
2013-06-25-280
2013-05-28-6-22
2013-04-233-63
2013-03-26638
2013-02-26-126-4
2013-01-225-124
2012-12-269512
2012-11-27-79-2
2012-10-234-74
2012-09-25-94-6
2012-08-28-17-9-11
2012-07-24-1-17-1
2012-06-264-15
2012-05-2214411
2012-04-247146
2012-03-2720718
2012-02-28122010
2012-01-243126
2011-12-27035
2011-11-22-60-2
2011-10-25-6-6-1
2011-09-27-10-6-9
2011-08-23-1-10-7
2011-07-263-15
2011-06-28-63-2
2011-05-2410-69
2011-04-26201020
2011-03-22252023
2011-02-22182517
2011-01-25251823
2010-12-2892511
2010-11-23596
2010-10-26-25-1
2010-09-2811-26
2010-08-24161114
2010-07-27231620
2010-06-22262321
2010-05-25302625
2010-04-276307
2010-03-23263
2010-02-23-220
2010-01-26-4-20
2009-12-221-44
2009-11-247110
2009-10-2714714
2009-09-22141417
2009-08-25141414
2009-07-286148
2009-06-23465
2009-05-26-94-7
2009-04-28-20-9-18
2009-03-24-51-20-52
2009-02-24-49-51-48
2009-01-27-55-49-50
2008-12-23-38-55-40
2008-11-25-26-38
2008-10-28-18-26-21
2008-09-23-16-18-12
2008-08-26-16-16-10
2008-07-22-12-16-9
2008-06-24-3-12-5
2008-05-270-31
2008-04-22603
2008-03-25-56-5
2008-02-26-8-5-10
2008-01-012.00-8
2007-12-010.002.00
2007-11-013.000.00
2007-10-011.003.00
2007-09-01-1.001.00
2007-08-01-1.00-1.00
2007-07-01-10.00-1.00
2007-06-01-10.00-10.00
2007-05-01-10.00-10.00
2007-04-01-2.00-10.00
2007-03-01-8.00-2.00
2007-02-01-2.00-8.00
2007-01-0111.00-2.00
2006-12-01-3.0011.00
2006-11-014.00-3.00
2006-10-01-5.004.00
2006-09-014.00-5.00
2006-08-01-2.004.00
2006-07-01-9.00-2.00
2006-06-018.00-9.00
2006-05-0114.008.00
2006-04-010.0014.00
2006-03-014.000.00
2006-02-01-1.004.00
2006-01-012.00-1.00
2005-12-015.002.00
2005-11-011.005.00
2005-10-011.001.00
2005-09-01-4.001.00
2005-08-014.00-4.00
2005-07-018.004.00
2005-06-013.008.00
2005-05-014.003.00
2005-04-0110.004.00
2005-03-016.0010.00
2005-02-017.006.00
2005-01-01-7.007.00
2004-12-012.00-7.00
2004-11-015.002.00
2004-10-015.005.00
2004-09-017.005.00
2004-08-019.007.00
2004-07-0114.009.00
2004-06-0113.0014.00
2004-05-0123.0013.00
2004-04-0112.0023.00
2004-03-0110.0012.00
2004-02-0111.0010.00
2004-01-013.0011.00
2003-12-016.003.00
2003-11-01-12.006.00
2003-10-01-6.00-12.00
2003-09-01-7.00-6.00
2003-08-01-3.00-7.00
2003-07-01-15.00-3.00
2003-06-01-16.00-15.00
2003-05-01-13.00-16.00
2003-04-01-11.00-13.00
2003-03-017.00-11.00
2003-02-01-5.007.00
2003-01-01-3.00-5.00
2002-12-01-4.00-3.00
2002-11-01-8.00-4.00
2002-10-01-1.00-8.00
2002-09-01-1.00-1.00
2002-08-011.00-1.00
2002-07-015.001.00
2002-06-0111.005.00
2002-05-018.0011.00
2002-04-016.008.00
2002-03-013.006.00
2002-02-01-16.003.00
2002-01-01-23.00-16.00
2001-12-01-16.00-23.00
2001-11-01-11.00-16.00
2001-10-01-5.00-11.00
2001-09-01-16.00-5.00
2001-08-01-22.00-16.00
2001-07-01-20.00-22.00
2001-06-01-18.00-20.00
2001-05-01-28.00-18.00
2001-04-01-12.00-28.00
2001-03-01-11.00-12.00
2001-02-01-6.00-11.00
2001-01-01-1.00-6.00
2000-12-01-1.00-1.00
2000-11-017.00-1.00
2000-10-019.007.00
15:00
Richmond Manufacturing Shipments (Nov) 4   -14
OpisThe Survey of Fifth District Manufacturing Activity - Business activity index. All firms surveyed are located within the Fifth Federal Reserve District, which includes the District of Columbia, Maryland, North Carolina, South Carolina, Virginia, and Most of West Virginia. Each index equals the precentage reporting increase minus the percentage reporting decrease.
PriorytetNiski
DataPoprzednia wartośćKolejna wartośćPrzewidywana wartość
2025-10-28-204
2025-09-23-5-20
2025-08-26-18-5
2025-07-22-5-18
2025-06-24-10-5
2025-05-28-17-10
2025-04-22-7-17
2025-03-2512-7
2025-02-25-912
2025-01-28-11-9
2024-12-24-12-11
2024-11-26-8-12
2024-10-22-18-8
2024-09-24-15-18
2024-08-27-21-15
2024-07-23-9-21
2024-06-2513-9
2024-05-29-1013
2024-04-23-14-10
2024-03-26-15-14
2024-02-27-15-15-4
2024-01-23-17-15
2023-12-27-8-17
2023-11-289-8
2023-10-2479
2023-09-26-57
2023-08-22-6-5
2023-07-25-5-6
2023-06-27-13-5
2023-05-23-7-13
2023-04-252-7
2023-03-28-152
2023-02-28-3-15
2023-01-245-3
2022-12-28-85
2022-11-22-3-8
2022-10-2514-3
2022-09-27-814
2022-08-237-8
2022-07-26-177
2022-06-28-14-17
2022-05-2417-14
2022-04-26917
2022-03-22-119
2022-02-2214-11
2022-01-251214
2021-12-28012
2021-11-2310
2021-10-26-11
2021-09-286-1
2021-08-24216
2021-07-271521
2021-06-221215
2021-05-251612
2021-04-272216
2021-03-231222
2021-02-231012
2021-01-261210
2020-12-222012
2020-11-243020
2020-10-271330
2020-09-222213
2020-08-252322
2020-07-28-123
2020-06-23-26-1
2020-05-27-70-26
2020-04-2813-70
2020-03-24113
2020-02-25291
2020-01-28-629
2019-12-24-2-6
2019-11-264-2
2019-10-22-144
2019-09-245-14
2019-08-27-135
2019-07-235-13
2019-06-2525
2019-05-29-22
2019-04-232-2
2019-03-26122
2019-02-26-812
2019-01-23-25-8
2018-12-2612-25
2018-11-28712
2018-10-23337
2018-09-252333
2018-08-281623
2018-07-241716
2018-06-261517
2018-05-22-815
2018-04-2415-8
2018-03-273115
2018-02-271531
2018-01-232415
2017-12-263324
2017-11-28933
2017-10-24229
2017-09-26822
2017-08-22138
2017-07-251113
2017-06-27-211
2017-05-2325-2
2017-04-251725
2017-03-281617
2017-02-281316
2017-01-241213
2016-12-27112
2016-11-2221
2016-10-25-42
2016-09-27-14-4
2016-08-237-14
2016-07-26-37
2016-06-28-8-3
2016-05-2414-8
2016-04-262714
2016-03-22-1127
2016-02-23-6-11
2016-01-260-6
2015-12-22-20
2015-11-24-4-2
2015-10-27-3-4
2015-09-22-4-3
2015-08-2516-4
2015-07-28016
2015-06-23-10
2015-05-26-6-1
2015-04-28-13-6
2015-03-24-1-13
2015-02-2410-1
2015-01-27510
2014-12-2315
2014-11-25231
2014-10-281123
2014-09-231011
2014-08-012.0010
2014-07-017.002.00
2014-06-014.007.00
2014-05-01-5.004.00
2014-04-01-2.00-5.00
2014-03-019.00-2.00
2014-02-0111.009.00
2014-01-0112.0011.00
2013-12-011.0012.00
2013-11-01-1.001.00
2013-10-0112.00-1.00
2013-09-01-5.0012.00
2013-08-0111.00-5.00
2013-07-017.0011.00
2013-06-01-8.007.00
2013-05-016.00-8.00
2013-04-018.006.00
2013-03-01-14.008.00
2013-02-011.00-14.00
2013-01-016.001.00
2012-12-01-2.006.00
2012-11-0110.00-2.00
2012-10-013.0010.00
2012-09-01-14.003.00
2012-08-010.00-14.00
2012-07-011.000.00
2012-06-0111.001.00
2012-05-012.0011.00
2012-04-018.002.00
2012-03-017.008.00
2012-02-01-2.007.00
2012-01-010.00-2.00
2011-12-012.000.00
2011-11-013.002.00
2011-10-01-3.003.00
2011-09-015.00-3.00
2011-08-011.005.00
2011-07-01-11.001.00
2011-06-011.00-11.00
2011-05-0117.001.00
2011-04-0116.0017.00
2011-03-0115.0016.00
2011-02-0126.0015.00
2011-01-018.0026.00
2010-12-0112.008.00
2010-11-012.0012.00
2010-10-010.002.00
2010-09-0114.000.00
2010-08-0116.0014.00
2010-07-0116.0016.00
2010-06-0122.0016.00
2010-05-015.0022.00
2010-04-0111.005.00
2010-03-0113.0011.00
2010-02-016.0013.00
2010-01-0110.006.00
2009-12-0112.0010.00
2009-11-015.0012.00
2009-10-0116.005.00
2009-09-01-1.0016.00
2009-08-01-17.00-1.00
2009-07-01-10.00-17.00
2009-06-01-22.00-10.00
2009-05-01-32.00-22.00
2009-04-01-43.00-32.00
2009-03-01-36.00-43.00
2009-02-01-30.00-36.00
2009-01-01-37.00-30.00
2008-12-01-28.00-37.00
2008-11-01-27.00-28.00
2008-10-01-8.00-27.00
2008-09-01-17.00-8.00
2008-08-01-6.00-17.00
2008-07-01-10.00-6.00
2008-06-01-12.00-10.00
2008-05-01-6.00-12.00
2008-04-01-14.00-6.00
2008-03-01-10.00-14.00
2008-02-01-9.00-10.00
2008-01-013.00-9.00
2007-12-010.003.00
2007-11-016.000.00
2007-10-013.006.00
2007-09-013.003.00
2007-08-012.003.00
2007-07-01-9.002.00
2007-06-01-13.00-9.00
2007-05-01-13.00-13.00
2007-04-01-4.00-13.00
2007-03-01-8.00-4.00
2007-02-012.00-8.00
2007-01-0113.002.00
2006-12-01-7.0013.00
2006-11-014.00-7.00
2006-10-01-16.004.00
2006-09-013.00-16.00
2006-08-01-7.003.00
2006-07-01-14.00-7.00
2006-06-0110.00-14.00
2006-05-0115.0010.00
2006-04-015.0015.00
2006-03-018.005.00
2006-02-012.008.00
2006-01-015.002.00
2005-12-013.005.00
2005-11-010.003.00
2005-10-014.000.00
2005-09-010.004.00
2005-08-019.000.00
2005-07-0112.009.00
2005-06-016.0012.00
2005-05-016.006.00
2005-04-0119.006.00
2005-03-013.0019.00
2005-02-019.003.00
2005-01-01-9.009.00
2004-12-017.00-9.00
2004-11-0113.007.00
2004-10-0111.0013.00
2004-09-015.0011.00
2004-08-0113.005.00
2004-07-0118.0013.00
2004-06-0116.0018.00
2004-05-0128.0016.00
2004-04-0114.0028.00
2004-03-0121.0014.00
2004-02-017.0021.00
2004-01-0110.007.00
2003-12-0116.0010.00
2003-11-01-7.0016.00
2003-10-01-2.00-7.00
2003-09-01-2.00-2.00
2003-08-01-3.00-2.00
2003-07-01-14.00-3.00
2003-06-01-13.00-14.00
2003-05-01-13.00-13.00
2003-04-01-5.00-13.00
2003-03-0112.00-5.00
2003-02-01-1.0012.00
2003-01-010.00-1.00
2002-12-011.000.00
2002-11-01-9.001.00
2002-10-013.00-9.00
2002-09-012.003.00
2002-08-016.002.00
2002-07-0112.006.00
2002-06-0115.0012.00
2002-05-0111.0015.00
2002-04-0114.0011.00
2002-03-019.0014.00
2002-02-01-18.009.00
2002-01-01-13.00-18.00
2001-12-01-12.00-13.00
2001-11-01-4.00-12.00
2001-10-017.00-4.00
2001-09-01-12.007.00
2001-08-01-18.00-12.00
2001-07-01-19.00-18.00
2001-06-01-15.00-19.00
2001-05-01-31.00-15.00
2001-04-01-11.00-31.00
2001-03-01-14.00-11.00
2001-02-01-1.00-14.00
2001-01-010.00-1.00
2000-12-01-3.000.00
2000-11-018.00-3.00
15:00
Richmond Services Index (Nov) 4   -4
OpisThe Survey of Fifth District Manufacturing Activity - Business activity index. All firms surveyed are located within the Fifth Federal Reserve District, which includes the District of Columbia, Maryland, North Carolina, South Carolina, Virginia, and Most of West Virginia. Each index equals the precentage reporting increase minus the percentage reporting decrease.
PriorytetNiski
DataPoprzednia wartośćKolejna wartośćPrzewidywana wartość
2025-10-2814
2025-09-2341
2025-08-2624
2025-07-22-12
2025-06-24-11-1
2025-05-28-7-11
2025-04-22-4-7
2025-03-2511-4
2025-02-25411
2025-01-28234
2024-12-24923
2024-11-2639
2024-10-22-13
2024-09-24-11-1
2024-08-275-11
2024-07-23-75
2024-06-253-7
2024-05-29-133
2024-04-23-7-13
2024-03-26-16-7
2024-02-274-16
2024-01-2304
2023-12-2710
2023-11-28-111
2023-10-244-11
2023-09-2644
2023-08-22-24-4
2023-07-25-8-29
2023-06-27-10-87
2023-05-23-23-10-29
2023-04-25-17-23-3
2023-03-28-3-17
2023-02-28-6-3
2023-01-24-12-6
2022-12-28-2-12
2022-11-22-8-2
2022-10-25-12-8
2022-09-27-12-12
2022-08-23-13-12
2022-07-260-13
2022-06-2880
2022-05-24138
2022-04-26913
2022-03-22119
2022-02-22411
2022-01-25124
2021-12-281212
2021-11-23912
2021-10-26-39
2021-09-2815-3
2021-08-241915
2021-07-272919
2021-06-222929
2021-05-252229
2021-04-271622
2021-03-23-616
2021-02-23-3-6
2021-01-26-9-3
2020-12-2213-9
2020-11-241913
2020-10-27619
2020-09-2226
2020-08-25-142
2020-07-28-28-14
2020-06-23-48-28
2020-05-27-87-48
2020-04-281-87
2020-03-24261
2020-02-251026
2020-01-281710
2019-12-241517
2019-11-262415
2019-10-22624
2019-09-2466
2019-08-27116
2019-07-231611
2019-06-25116
2019-05-29261
2019-04-23526
2019-03-26175
2019-02-26617
2019-01-23106
2018-12-26510
2018-11-28-15
2018-10-2318-1
2018-09-253118
2018-08-282331
2018-07-241923
2018-06-261119
2018-05-22211
2018-04-24252
2018-03-272725
2018-02-272027
2018-01-232520
2017-12-263025
2017-11-282430
2017-10-242224
2017-09-262222
2017-08-221222
2017-07-251912
2017-06-273419
2017-05-232234
2017-04-25922
2017-03-28159
2017-02-281515
2017-01-24415
2016-12-2734
2016-11-2273
2016-10-25137
2016-09-27013
2016-08-2380
2016-07-2628
2016-06-28112
2016-05-241511
2016-04-26915
2016-03-22-29
2016-02-2310-2
2016-01-26010
2015-12-22-10
2015-11-2418-1
2015-10-271018
2015-09-223010
2015-08-253230
2015-07-281932
2015-06-231319
2015-05-26213
2015-04-28122
2015-03-241812
2015-02-241418
2015-01-27314
2014-12-23253
2014-11-252725
2014-10-282127
2014-09-232121
2014-08-016.0021
2014-07-0112.006.00
2014-06-010.0012.00
2014-05-014.000.00
2014-04-011.004.00
2014-03-012.001.00
2014-02-014.002.00
2014-01-017.004.00
2013-12-017.007.00
2013-11-0112.007.00
2013-10-0110.0012.00
2013-09-011.0010.00
2013-08-0110.001.00
2013-07-0110.0010.00
2013-06-01-9.0010.00
2013-05-012.00-9.00
2013-04-019.002.00
2013-03-0113.009.00
2013-02-014.0013.00
2013-01-014.004.00
2012-12-012.004.00
2012-11-019.002.00
2012-10-010.009.00
2012-09-01-5.000.00
2012-08-016.00-5.00
2012-07-01-1.006.00
2012-06-01-1.00-1.00
2012-05-0121.00-1.00
2012-04-018.0021.00
2012-03-0112.008.00
2012-02-017.0012.00
2012-01-014.007.00
2011-12-010.004.00
2011-11-01-3.000.00
2011-10-013.00-3.00
2011-09-0113.003.00
2011-08-01-5.0013.00
2011-07-016.00-5.00
2011-06-0118.006.00
2011-05-019.0018.00
2011-04-018.009.00
2011-03-0111.008.00
2011-02-0117.0011.00
2011-01-014.0017.00
2010-12-013.004.00
2010-11-01-6.003.00
2010-10-01-6.00-6.00
2010-09-018.00-6.00
2010-08-012.008.00
2010-07-018.002.00
2010-06-015.008.00
2010-05-01-3.005.00
2010-04-01-14.00-3.00
2010-03-01-10.00-14.00
2010-02-01-14.00-10.00
2010-01-01-9.00-14.00
2009-12-01-14.00-9.00
2009-11-01-9.00-14.00
2009-10-011.00-9.00
2009-09-01-16.001.00
2009-08-01-25.00-16.00
2009-07-01-27.00-25.00
2009-06-01-32.00-27.00
2009-05-01-30.00-32.00
2009-04-01-26.00-30.00
2009-03-01-20.00-26.00
2009-02-01-33.00-20.00
2009-01-01-26.00-33.00
2008-12-01-7.00-26.00
2008-11-01-13.00-7.00
2008-10-01-4.00-13.00
2008-09-01-16.00-4.00
2008-08-01-12.00-16.00
2008-07-01-7.00-12.00
2008-06-01-6.00-7.00
2008-05-01-6.00-6.00
2008-04-01-1.00-6.00
2008-03-01-15.00-1.00
2008-02-010.00-15.00
2008-01-01-2.000.00
2007-12-015.00-2.00
2007-11-01-6.005.00
2007-10-01-6.00-6.00
2007-09-015.00-6.00
2007-08-0116.005.00
2007-07-015.0016.00
2007-06-013.005.00
2007-05-016.003.00
2007-04-0111.006.00
2007-03-010.0011.00
2007-02-017.000.00
2007-01-0110.007.00
2006-12-014.0010.00
2006-11-0114.004.00
2006-10-0113.0014.00
2006-09-01-2.0013.00
2006-08-0114.00-2.00
2006-07-0113.0014.00
2006-06-018.0013.00
2006-05-016.008.00
2006-04-017.006.00
2006-03-0118.007.00
2006-02-0115.0018.00
2006-01-0111.0015.00
2005-12-0124.0011.00
2005-11-0120.0024.00
2005-10-0121.0020.00
2005-09-0126.0021.00
2005-08-0112.0026.00
2005-07-0111.0012.00
2005-06-017.0011.00
2005-05-019.007.00
2005-04-0112.009.00
2005-03-0117.0012.00
2005-02-019.0017.00
2005-01-0115.009.00
2004-12-019.0015.00
2004-11-0115.009.00
2004-10-014.0015.00
2004-09-0113.004.00
2004-08-019.0013.00
2004-07-0116.009.00
2004-06-0117.0016.00
2004-05-0111.0017.00
2004-04-0111.0011.00
2004-03-0112.0011.00
2004-02-0117.0012.00
2004-01-016.0017.00
2003-12-0116.006.00
2003-11-014.0016.00
2003-10-0119.004.00
2003-09-0125.0019.00
2003-08-01-16.0025.00
2003-07-01-9.00-16.00
2003-06-01-6.00-9.00
2003-05-010.00-6.00
2003-04-01-28.000.00
2003-03-018.00-28.00
2003-02-01-21.008.00
2003-01-010.00-21.00
2002-12-01-26.000.00
2002-11-012.00-26.00
2002-10-011.002.00
2002-09-01-16.001.00
2002-08-01-2.00-16.00
2002-07-01-4.00-2.00
2002-06-01-1.00-4.00
2002-05-0118.00-1.00
2002-04-0113.0018.00
2002-03-01-12.0013.00
2002-02-019.00-12.00
2002-01-01-8.009.00
2001-12-010.00-8.00
2001-11-01-20.000.00
2001-10-01-8.00-20.00
2001-09-01-12.00-8.00
2001-08-012.00-12.00
2001-07-01-15.002.00
2001-06-0116.00-15.00
2001-05-01-8.0016.00
2001-04-01-8.00-8.00
2001-03-01-10.00-8.00
2001-02-01-12.00-10.00
2001-01-01-7.00-12.00
2000-12-01-6.00-7.00
2000-11-01-4.00-6.00
15:00
Current Account (USD) (Q3) -1,791M   2,325M
OpisCurrent account records the values of the following: - trade balance exports and imports of goods and services - income payments and expenditure interest, dividends, salaries - unilateral transfers aid, taxes, one-way gifts It shows how a country deals with the global economy on a non-investment basis. Positive current account balance is when inflows from its components into the country exceed outflows of the capital leaving the country. Current account surplus may strengthen the demand for local currency. Persistent deficit may lead to a depreciation of a currency.
PriorytetNiski
DataPoprzednia wartośćKolejna wartośćPrzewidywana wartość
2025-08-25-11,171M206M3,762M
2025-05-2312,813M-11,171M-18,050M
2025-02-251,104M12,813M
2024-11-263,639M1,104M
2024-11-252,854M3,639M
2024-08-23-21,374M2,854M
2024-05-2411,817M-21,374M
2024-02-23908M11,817M5,000M
2023-11-243,496M908M2,725M
2023-08-25-14,282M3,496M-3,399M
2023-05-252,574M-14,282M
2023-02-24-5,151M2,574M4,400M
2022-11-25-504M-5,151M-5,500M
2022-08-25-8,092M-504M-2,800M
2022-05-252,741M-8,092M
2022-02-25-4,651M2,741M
2021-11-256,045M-4,651M400M
2021-08-25-5,492M6,045M400M
2021-05-2517,211M-5,492M
2021-02-2517,125M17,211M
2020-11-25-116M17,125M-1,900M
2020-08-25-2,297M-116M-1,900M
2020-05-253,198M-2,297M-2,200M
2020-02-25820M3,198M3,500M
2019-11-255,143M820M
2019-08-23-5,634M5,143M-3,215M
2019-05-24-2,937M-5,634M
2019-02-25-5,703M-2,937M-3,302M
2018-11-23-3,882M-5,703M-4,400M
2018-08-24-6,941M-3,882M
2018-05-25-3,207M-6,941M-5,515M
2018-02-23-5,173M-3,207M-2,000M
2017-11-24-321M-5,173M-7,200M
2017-08-25-6,859M-321M-4,650M
2017-05-25-2,418M-6,859M-6,916M
2017-02-24-7,571M-2,418M-4,820M
2016-11-25-8,041M-7,571M
2016-08-25-7,698M-8,041M-6,700M
2016-05-25-7,698M-7,698M-8,400M
2016-02-25-8,856M-7,698M-7,900M
2015-11-25-7,980M-8,856M-8,120M
2015-08-25-9,446M-7,980M-7,821M
2015-05-25-5,310M-9,446M-7,090M
2015-02-25-2,702M-5,310M-7,611M
2014-11-25-6,982M-2,702M-6,832M
2014-08-250-6,982M-4,011M
15:00
Current Account % of GDP (Q3) 0,00%   0,50%
OpisCurrent account records the values of the following: - trade balance exports and imports of goods and services - income payments and expenditure interest, dividends, salaries - unilateral transfers aid, taxes, one-way gifts It shows how a country deals with the global economy on a non-investment basis. Positive current account balance is when inflows from its components into the country exceed outflows of the capital leaving the country. Current account surplus may strengthen the demand for local currency. Persistent deficit may lead to a depreciation of a currency.
PriorytetNiski
DataPoprzednia wartośćKolejna wartośćPrzewidywana wartość
2025-08-25-1.80%0.00%
2025-05-232.90%-1.80%
2025-02-250.20%2.90%
2024-11-250.60%0.20%
2024-08-23-4.50%0.60%
2024-05-242.50%-4.50%
2024-02-230.60%2.50%
2023-11-240.80%0.60%
2023-08-25-5.20%0.80%
2023-05-251.20%-5.20%
2023-02-24-1.60%1.20%
2022-11-25-0.10%-1.60%
2022-08-25-2.40%-0.10%
2022-05-250.80%-2.40%
2022-02-25-1.40%0.80%
2021-11-251.90%-1.40%
2021-08-25-1.70%1.90%
2021-05-255.80%-1.70%
2021-02-256.90%5.80%
2020-11-25-0.40%6.90%
2020-08-25-0.40%-0.40%
2020-05-250.80%-0.40%
2020-02-250.30%0.80%
2019-08-23-1.80%0.30%
2019-05-24-1.00%-1.80%
2019-02-25-1.90%-1.00%
2018-11-232.10%-1.90%
2018-08-242.30%2.10%
2018-05-251.00%2.30%
2018-02-231.70%1.00%
2017-11-240.10%1.70%
2017-08-253.30%0.10%
2017-05-252.70%3.30%
2017-02-242.90%2.70%
2016-11-253.00%2.90%
2016-08-25-2.80%3.00%
2016-02-252.90%-2.80%
2015-11-252.80%2.90%
2015-08-253.20%2.80%
2015-05-252.10%3.20%
2015-02-252.00%2.10%
2014-11-2502.00%
15:00
Interest Rate Decision 27,00%   27,00%
OpisMonetary policy refers to the actions undertaken by a country's monetary authority, central bank or government to achieve certain national economic goals. It is based on the relationship between interest rates at which money can be borrowed and total supply of money. Policy rates are the most important rates within a country's monetary policy. These can be: deposit rates, lombard rates, rediscount rates, reference rates etc. Changing them influences economic growth, inflation, exchange rates and unemployment.
PriorytetNiski
DataPoprzednia wartośćKolejna wartośćPrzewidywana wartość
2025-09-2327.50%27.00%27.00%
2025-07-2227.50%27.50%
2025-05-2027.50%27.50%
2025-02-2027.50%27.50%
2024-11-2627.25%27.50%
2024-09-2426.75%27.25%
2024-07-2326.25%26.75%
2024-05-2124.75%26.25%
2024-03-2622.75%24.75%24.75%
2024-02-2718.75%22.75%21.00%
2023-07-2518.50%18.75%
2023-05-2418.00%18.50%
2023-03-2117.50%18.00%16.50%
2023-01-2416.50%17.50%16.50%
2022-11-2215.50%16.50%16.50%
2022-09-2714.00%15.50%14.50%
2022-09-2714.00%14.00%14.50%
2022-07-1913.00%14.00%
2022-05-2411.50%13.00%11.50%
2022-03-2111.50%11.50%11.50%
2022-01-2511.50%11.50%11.50%
2021-11-2311.50%11.50%11.50%
2021-09-1711.50%11.50%
2021-07-2711.50%11.50%11.50%
2021-05-2511.50%11.50%11.50%
2021-03-2311.50%11.50%
2021-01-2611.50%11.50%
2020-11-2411.50%11.50%11.50%
2020-09-2212.50%11.50%
2020-07-2012.50%12.50%
2020-05-2813.50%12.50%13.50%
2020-03-2413.50%13.50%13.50%
2020-01-2413.50%13.50%13.50%
2019-11-2613.50%13.50%13.50%
2019-09-2013.50%13.50%
2019-07-2313.50%13.50%13.50%
2019-05-2113.50%13.50%13.50%
2019-03-2614.00%13.50%14.00%
2019-01-2214.00%14.00%14.00%
2018-11-2214.00%14.00%14.00%
2018-09-2514.00%14.00%14.00%
2018-07-2414.00%14.00%14.00%
2018-05-2214.00%14.00%14.00%
2018-04-0414.00%14.00%14.00%
2018-01-2314.00%14.00%14.00%
2017-11-2114.00%14.00%14.00%
2017-09-2614.00%14.00%14.00%
2017-07-2514.00%14.00%14.00%
2017-05-2314.00%14.00%14.00%
2017-03-2114.00%14.00%14.00%
2017-01-2414.00%14.00%14.00%
2016-11-2214.00%14.00%14.00%
2016-09-2014.00%14.00%14.00%
2016-07-2612.00%14.00%13.00%
2016-05-2412.00%12.00%13.00%
2016-03-2211.00%12.00%11.00%
2016-01-2611.00%11.00%11.00%
2015-11-2413.00%11.00%13.00%
2015-09-2213.00%13.00%13.00%
2015-07-2413.00%13.00%13.00%
2015-05-1913.00%13.00%13.00%
2015-03-2413.00%13.00%13.00%
2015-01-2013.00%13.00%13.00%
2014-11-2512.00%13.00%
2014-09-1912.00%12.00%12.00%
2014-08-0112.00%12.00%
2014-07-0112.00%12.00%
2014-06-0112.00%12.00%
2014-05-0112.00%12.00%
2014-04-0112.00%12.00%
2014-03-0112.00%12.00%
2014-02-0112.00%12.00%
2014-01-0112.00%12.00%
2013-12-0112.00%12.00%
2013-11-0112.00%12.00%
2013-10-0112.00%12.00%
2013-09-0112.00%12.00%
2013-08-0112.00%12.00%
2013-07-0112.00%12.00%
2013-06-0112.00%12.00%
2013-05-0112.00%12.00%
2013-04-0112.00%12.00%
2013-03-0112.00%12.00%
2013-02-0112.00%12.00%
2013-01-0112.00%12.00%
2012-12-0112.00%12.00%
2012-11-0112.00%12.00%
2012-10-0112.00%12.00%
2012-09-0112.00%12.00%
2012-08-0112.00%12.00%
2012-07-0112.00%12.00%
2012-06-0112.00%12.00%
2012-05-0112.00%12.00%
2012-04-0112.00%12.00%
2012-03-0112.00%12.00%
2012-02-0112.00%12.00%
2012-01-0112.00%12.00%
2011-12-0111.35%12.00%
2011-11-018.98%11.35%
2011-10-018.75%8.98%
2011-09-018.14%8.75%
2011-08-018.00%8.14%
2011-07-017.64%8.00%
2011-06-017.50%7.64%
2011-05-016.85%7.50%
2011-04-016.50%6.85%
2011-03-016.31%6.50%
2011-02-016.25%6.31%
2011-01-016.25%6.25%
2010-12-016.25%6.25%
2010-11-016.09%6.25%
2010-10-016.00%6.09%
2010-09-016.00%6.00%
2010-08-016.00%6.00%
2010-07-016.00%6.00%
2010-06-016.00%6.00%
2010-05-016.00%6.00%
2010-04-016.00%6.00%
2010-03-016.00%6.00%
2010-02-016.00%6.00%
2010-01-016.00%6.00%
2009-12-016.00%6.00%
2009-11-016.00%6.00%
2009-10-016.00%6.00%
2009-09-016.35%6.00%
2009-08-018.00%6.35%
2009-07-018.00%8.00%
2009-06-018.72%8.00%
2009-05-019.75%8.72%
2009-04-019.75%9.75%
2009-03-019.75%9.75%
2009-02-019.75%9.75%
2009-01-019.75%9.75%
2008-12-019.75%9.75%
2008-11-0110.07%9.75%
2008-10-0110.25%10.07%
2008-09-0110.25%10.25%
2008-08-0110.25%10.25%
2008-07-0110.00%10.25%
2008-06-0110.00%10.00%
2008-05-019.50%10.00%
2008-04-019.50%9.50%
2008-03-019.50%9.50%
2008-02-019.48%9.50%
2008-01-019.00%9.48%
2007-12-018.91%9.00%
2007-11-018.00%8.91%
2007-10-018.00%8.00%
2007-09-018.00%8.00%
2007-08-018.00%8.00%
2007-07-0108.00%
15:00
Business Inventories (MoM) (Aug) 0,1% 0,0% 0,0%
OpisBusiness Inventories measures the change in the worth of unsold goods held by manufacturers, wholesalers, and retailers. A high reading can indicate a lack of consumer demand.A higher than expected reading should be taken as negative/bearish for the USD, while a lower than expected reading should be taken as positive/bullish for the USD.
Priorytet Średni
DataPoprzednia wartośćKolejna wartośćPrzewidywana wartość
2025-09-160.2%0.2%0.2%
2025-08-150.0%0.2%0.2%
2025-07-170.0%0.0%0.0%
2025-06-170.1%0.0%0.0%
2025-05-150.2%0.1%0.2%
2025-04-160.3%0.2%0.3%
2025-03-17-0.2%0.3%0.3%
2025-02-140.1%-0.2%0.0%
2025-01-160.0%0.1%0.1%
2024-12-170.0%0.0%0.2%
2024-11-150.3%0.0%0.2%
2024-10-170.3%0.3%0.3%
2024-09-170.3%0.3%0.3%
2024-08-150.5%0.3%0.3%
2024-07-160.3%0.5%0.4%
2024-06-18-0.1%0.3%0.3%
2024-05-150.3%-0.1%0.0%
2024-04-150.0%0.3%0.3%
2024-03-140.3%0.0%0.2%
2024-02-15-0.1%0.3%0.4%
2024-01-17-0.1%-0.1%-0.1%
2023-12-140.2%-0.1%0.0%
2023-11-150.4%0.2%0.4%
2023-10-170.1%0.4%0.3%
2023-09-14-0.1%0.1%0.1%
2023-08-150.2%-0.1%0.1%
2023-07-180.1%0.2%0.2%
2023-06-15-0.2%0.1%0.2%
2023-05-160.0%-0.2%0.1%
2023-04-14-0.2%0.0%0.3%
2023-03-150.3%-0.2%0.1%
2023-02-150.3%0.3%0.3%
2023-01-180.2%0.3%0.4%
2022-12-150.2%0.2%0.4%
2022-11-160.9%0.2%0.5%
2022-10-140.5%0.9%0.9%
2022-09-151.4%0.5%0.6%
2022-08-171.6%1.4%1.4%
2022-07-151.3%1.6%1.3%
2022-06-152.4%1.3%1.2%
2022-05-171.8%2.4%1.9%
2022-04-141.3%1.8%1.3%
2022-03-162.4%1.3%1.1%
2022-02-161.5%2.4%2.1%
2022-01-141.3%1.5%1.3%
2021-12-150.8%1.3%1.1%
2021-11-160.8%0.8%0.6%
2021-10-150.6%0.8%0.6%
2021-09-160.9%0.6%0.5%
2021-08-170.6%0.9%0.8%
2021-07-160.1%0.6%0.5%
2021-06-150.2%0.1%-0.1%
2021-05-140.6%0.2%0.3%
2021-04-150.4%0.6%0.5%
2021-03-160.8%0.4%0.3%
2021-02-170.5%0.8%0.5%
2021-01-150.8%0.5%0.5%
2020-12-160.8%0.8%0.7%
2020-11-170.3%0.8%0.6%
2020-10-16-5.5%0.3%0.4%
2020-09-16-1.1%-5.5%0.1%
2020-08-14-2.3%-1.1%-1.2%
2020-07-16-1.4%-2.3%-2.3%
2020-06-16-0.3%-1.4%-0.8%
2020-05-15-0.5%-0.3%-0.2%
2020-04-15-0.3%-0.5%-0.4%
2020-03-170.1%-0.3%-0.1%
2020-02-14-0.2%0.1%0.1%
2020-01-160.1%-0.2%-0.1%
2019-12-13-0.1%0.1%0.2%
2019-11-15-0.1%-0.1%0.1%
2019-10-160.3%-0.1%0.2%
2019-09-130.0%0.3%0.3%
2019-08-150.3%0.0%0.1%
2019-07-160.5%0.3%0.4%
2019-06-140.0%0.5%0.4%
2019-05-150.3%0.0%0.0%
2019-04-180.9%0.3%0.4%
2019-04-010.8%0.9%0.5%
2019-03-11-0.1%0.8%0.6%
2019-02-140.6%-0.1%0.3%
2018-12-140.5%0.6%0.6%
2018-11-150.5%0.5%0.3%
2018-10-150.7%0.5%0.5%
2018-09-140.1%0.7%0.5%
2018-08-150.3%0.1%0.2%
2018-07-160.3%0.3%0.4%
2018-06-14-0.1%0.3%0.3%
2018-05-150.6%-0.1%0.2%
2018-04-160.6%0.6%0.6%
2018-03-140.6%0.6%0.6%
2018-02-140.4%0.6%0.3%
2018-01-12-0.1%0.4%0.3%
2017-12-140.0%-0.1%-0.1%
2017-11-150.6%0.0%0.1%
2017-10-130.3%0.6%0.7%
2017-09-150.5%0.3%0.2%
2017-08-150.3%0.5%0.4%
2017-07-14-0.2%0.3%0.3%
2017-06-140.2%-0.2%-0.2%
2017-05-120.2%0.2%0.1%
2017-04-140.3%0.2%0.3%
2017-03-150.4%0.3%0.3%
2017-02-150.8%0.4%0.4%
2017-01-13-0.1%0.8%0.5%
2016-12-140.1%-0.1%-0.1%
2016-11-150.2%0.1%0.2%
2016-10-140.0%0.2%0.2%
2016-09-150.2%0.0%0.1%
2016-08-120.2%0.2%0.1%
2016-07-150.1%0.2%0.1%
2016-06-140.3%0.1%0.2%
2016-05-13-0.1%0.3%0.2%
2016-04-13-0.1%-0.1%-0.1%
2016-03-150.1%-0.1%-0.1%
2016-02-12-0.1%0.1%0.1%
2016-01-15-0.1%-0.1%-0.1%
2015-12-110.1%-0.1%0.1%
2015-11-130.1%0.1%0.1%
2015-10-140.0%0.1%0.1%
2015-09-150.7%0.0%0.1%
2015-08-130.3%0.7%0.3%
2015-07-140.4%0.3%0.3%
2015-06-110.1%0.4%0.2%
2015-05-130.2%0.1%0.2%
2015-04-140.0%0.2%0.2%
2015-03-120.1%0.0%0.1%
2015-02-120.2%0.1%0.2%
2015-01-140.2%0.2%0.2%
2014-12-110.3%0.2%0.2%
2014-11-140.1%0.3%0.3%
2014-10-150.4%0.1%0.4%
2014-09-120.4%0.4%0.4%
2014-08-130.5%0.4%0.4%
2014-07-150.6%0.5%0.6%
2014-06-120.4%0.6%0.4%
2014-05-130.5%0.4%0.4%
2014-04-140.4%0.5%0.5%
2014-03-130.5%0.4%0.4%
2014-02-130.4%0.5%0.5%
2014-01-140.8%0.4%0.3%
2013-12-120.6%0.8%0.3%
2013-11-200.4%0.6%0.3%
2013-10-290.4%0.4%0.3%
2013-09-130.1%0.4%0.2%
2013-08-13-0.1%0.1%0.2%
2013-07-150.2%-0.1%0.1%
2013-06-13-0.1%0.2%0.3%
2013-05-130.0%-0.1%0.3%
2013-04-120.9%0.0%0.4%
2013-03-130.3%0.9%0.4%
2013-02-130.2%0.3%0.3%
2013-01-150.3%0.2%0.3%
2012-12-130.7%0.3%0.4%
2012-11-140.6%0.7%0.5%
2012-10-150.8%0.6%0.5%
2012-09-140.1%0.8%0.3%
2012-08-140.3%0.1%0.2%
2012-07-160.3%0.3%0.2%
2012-06-130.3%0.3%0.3%
2012-05-150.6%0.3%0.4%
2012-04-160.8%0.6%0.6%
2012-03-130.6%0.8%0.6%
2012-02-140.3%0.6%0.4%
2012-01-120.8%0.3%0.4%
2011-12-130.0%0.8%0.5%
2011-11-150.4%0.0%0.2%
2011-10-140.5%0.4%0.4%
2011-09-140.4%0.5%0.5%
2011-08-120.9%0.4%0.6%
2011-07-141.0%0.9%0.7%
2011-06-141.3%1.0%0.9%
2011-05-120.7%1.3%0.8%
2011-04-131.0%0.7%0.8%
2011-03-111.1%1.0%0.8%
2011-02-150.4%1.1%0.7%
2011-01-140.8%0.4%0.7%
2010-12-141.3%0.8%1.1%
2010-11-150.9%1.3%0.9%
2010-10-151.1%0.9%0.5%
2010-09-140.5%1.1%0.8%
2010-08-130.2%0.5%0.2%
2010-07-140.4%0.2%0.2%
2010-06-110.7%0.4%0.5%
2010-05-140.4%0.7%0.4%
2010-04-140.2%0.4%0.3%
2010-03-12-0.3%0.2%0.2%
2010-02-120.5%-0.3%0.4%
2010-01-140.4%0.5%0.0%
2009-12-11-0.5%0.4%-0.3%
2009-11-16-1.6%-0.5%-0.7%
2009-10-14-1.1%-1.6%-0.9%
2009-09-15-1.4%-1.1%-0.7%
2009-08-13-1.2%-1.4%-0.9%
2009-07-14-1.1%-1.2%-1.0%
2009-06-11-1.3%-1.1%-1.0%
2009-05-13-1.4%-1.3%-1.2%
2009-04-14-1.1%-1.4%-0.9%
2009-03-12-1.3%-1.1%-1.2%
2009-02-12-0.7%-1.3%-0.8%
2009-01-14-0.6%-0.7%-0.5%
2008-12-12-0.2%-0.6%-0.3%
2008-11-140.3%-0.2%0.1%
2008-10-151.1%0.3%0.5%
2008-09-120.7%1.1%0.5%
2008-08-130.3%0.7%0.5%
2008-07-150.5%0.3%0.5%
2008-06-120.1%0.5%0.3%
2008-05-130.6%0.1%0.4%
2008-04-140.8%0.6%0.6%
2008-03-130.6%0.8%0.5%
2008-02-130.4%0.6%0.4%
2008-01-010.60%0.4%
2007-12-010.40%0.60%
2007-11-010.60%0.40%
2007-10-010.40%0.60%
2007-09-010.10%0.40%
2007-08-010.50%0.10%
2007-07-010.70%0.50%
2007-06-010.50%0.70%
2007-05-010.20%0.50%
2007-04-010.40%0.20%
2007-03-010.40%0.40%
2007-02-010.10%0.40%
2007-01-010.40%0.10%
2006-12-010.30%0.40%
2006-11-010.40%0.30%
2006-10-010.70%0.40%
2006-09-010.40%0.70%
2006-08-010.90%0.40%
2006-07-011.10%0.90%
2006-06-010.60%1.10%
2006-05-011.00%0.60%
2006-04-010.30%1.00%
2006-03-010.70%0.30%
2006-02-011.00%0.70%
2006-01-010.70%1.00%
2005-12-010.70%0.70%
2005-11-010.60%0.70%
2005-10-010.30%0.60%
2005-09-01-0.40%0.30%
2005-08-010.00%-0.40%
2005-07-010.10%0.00%
2005-06-010.50%0.10%
2005-05-010.60%0.50%
2005-04-010.70%0.60%
2005-03-010.90%0.70%
2005-02-010.20%0.90%
2005-01-011.10%0.20%
2004-12-010.70%1.10%
2004-11-010.00%0.70%
2004-10-010.80%0.00%
2004-09-011.00%0.80%
2004-08-011.00%1.00%
2004-07-010.60%1.00%
2004-06-010.70%0.60%
2004-05-010.80%0.70%
2004-04-010.90%0.80%
2004-03-010.10%0.90%
2004-02-010.20%0.10%
2004-01-010.20%0.20%
2003-12-010.50%0.20%
2003-11-010.40%0.50%
2003-10-01-0.60%0.40%
2003-09-01-0.20%-0.60%
2003-08-01-0.30%-0.20%
2003-07-01-0.40%-0.30%
2003-06-010.10%-0.40%
2003-05-010.00%0.10%
2003-04-010.80%0.00%
2003-03-010.10%0.80%
2003-02-010.60%0.10%
2003-01-010.20%0.60%
2002-12-010.20%0.20%
2002-11-010.70%0.20%
2002-10-010.10%0.70%
2002-09-010.60%0.10%
2002-08-010.20%0.60%
2002-07-010.30%0.20%
2002-06-01-0.10%0.30%
2002-05-01-0.40%-0.10%
2002-04-01-0.50%-0.40%
2002-03-01-0.10%-0.50%
2002-02-01-0.70%-0.10%
2002-01-01-1.10%-0.70%
2001-12-01-1.60%-1.10%
2001-11-01-0.60%-1.60%
2001-10-01-0.10%-0.60%
2001-09-01-0.70%-0.10%
2001-08-01-0.80%-0.70%
2001-07-01-0.20%-0.80%
2001-06-01-0.10%-0.20%
2001-05-01-0.50%-0.10%
2001-04-01-0.50%-0.50%
2001-03-010.20%-0.50%
2001-02-01-0.10%0.20%
2001-01-010.60%-0.10%
2000-12-010.60%0.60%
2000-11-010.00%0.60%
2000-10-010.70%0.00%
15:00
Retail Inventories Ex Auto (Aug) 0,1% 0,3% 0,0%
Opis
Priorytet Średni
DataPoprzednia wartośćKolejna wartośćPrzewidywana wartość
2025-09-250.2%0.3%
2025-09-160.1%0.2%-0.1%
2025-08-29-0.1%0.1%
2025-08-150.1%-0.1%0.0%
2025-07-290.1%0.1%
2025-07-170.2%0.1%0.2%
2025-06-260.3%0.2%
2025-06-170.3%0.3%0.3%
2025-05-300.3%0.3%
2025-05-150.1%0.3%0.4%
2025-04-290.1%0.1%
2025-04-160.5%0.1%0.1%
2025-03-270.5%0.5%
2025-03-17-0.1%0.5%0.4%
2025-02-28-0.1%-0.1%
2025-02-140.5%-0.1%0.2%
2025-01-290.4%0.5%
2025-01-160.3%0.4%0.6%
2024-12-270.3%0.3%
2024-12-170.1%0.3%0.1%
2024-11-270.1%0.1%
2024-11-150.1%0.1%0.3%
2024-10-290.5%0.1%
2024-10-170.4%0.5%0.4%
2024-09-270.5%0.4%
2024-09-170.3%0.5%0.5%
2024-08-290.3%0.3%
2024-08-150.0%0.3%0.2%
2024-07-24-0.1%0.0%
2024-07-160.3%-0.1%0.0%
2024-06-270.2%0.3%
2024-06-18-0.4%0.2%0.3%
2024-05-30-0.4%-0.4%
2024-05-15-0.1%-0.4%-0.1%
2024-04-250.3%-0.1%
2024-04-150.3%0.3%0.4%
2024-03-290.3%0.3%
2024-03-140.4%0.3%0.3%
2024-02-280.4%0.4%
2024-02-15-0.9%0.4%0.6%
2024-01-25-0.6%-0.9%
2024-01-17-1.1%-0.6%-0.8%
2023-12-28-1.1%-1.1%
2023-12-140.4%-1.1%-0.9%
2023-11-29-0.4%0.4%
2023-11-150.5%-0.4%0.3%
2023-10-260.6%0.5%
2023-10-170.0%0.6%0.6%
2023-09-290.0%0.0%
2023-09-140.1%0.0%
2023-08-300.2%0.1%
2023-08-15-0.1%0.2%0.4%
2023-07-27-0.1%-0.1%
2023-07-18-0.2%-0.1%0.0%
2023-06-28-0.3%-0.2%
2023-06-150.3%-0.3%-0.1%
2023-05-260.1%0.3%
2023-05-16-0.2%0.1%0.4%
2023-04-26-0.1%-0.2%0.1%
2023-04-140.1%-0.1%0.4%
2023-03-280.1%0.1%
2023-03-150.2%0.1%0.2%
2023-02-280.1%0.2%
2023-02-15-0.3%0.1%0.3%
2023-01-26-0.4%-0.3%
2023-01-18-0.6%-0.4%
2022-12-27-0.7%-0.6%
2022-12-15-0.4%-0.7%
2022-11-30-0.9%-0.4%-0.2%
2022-11-160.6%-0.9%-0.1%
2022-10-260.7%0.6%
2022-10-140.6%0.7%
2022-09-280.3%0.6%
2022-09-150.4%0.3%
2022-08-261.5%0.4%
2022-08-171.4%1.5%1.6%
2022-07-271.4%1.4%
2022-07-150.8%1.4%
2022-06-281.7%0.8%
2022-06-151.7%1.7%
2022-05-273.5%1.7%
2022-05-171.4%3.5%2.3%
2022-04-271.5%1.4%
2022-04-141.8%1.5%1.2%
2022-03-281.7%1.8%
2022-03-163.3%1.7%1.7%
2022-02-283.9%3.3%
2022-02-163.6%3.9%
2022-01-261.2%3.6%
2022-01-141.3%1.2%
2021-12-290.7%1.3%
2021-12-150.4%0.7%
2021-11-240.8%0.4%
2021-11-160.6%0.8%
2021-10-270.6%0.6%
2021-10-150.6%0.6%
2021-09-280.5%0.6%
2021-09-160.5%0.5%
2021-08-270.8%0.5%
2021-08-170.6%0.8%
2021-07-280.9%0.6%
2021-07-160.9%0.9%
2021-06-240.7%0.9%
2021-06-150.5%0.7%
2021-05-280.7%0.5%
2021-05-140.6%0.7%
2021-04-281.4%0.6%
2021-04-151.2%1.4%
2021-03-260.2%1.2%
2021-03-16-0.2%0.2%
2021-02-262.2%-0.2%
2021-02-171.1%2.2%
2021-01-280.4%1.1%
2021-01-150.3%0.4%
2020-12-300.9%0.3%
2020-12-160.7%0.9%
2020-11-251.0%0.7%
2020-11-170.9%1.0%
2020-10-280.5%0.9%
2020-10-160.9%0.5%
2020-09-290.6%0.9%
2020-09-160.6%0.6%
2020-08-28-0.9%0.6%
2020-08-14-0.8%-0.9%
2020-07-29-1.7%-0.8%
2020-07-16-1.5%-1.7%
2020-06-25-1.2%-1.5%
2020-06-16-1.1%-1.2%
2020-05-29-0.8%-1.1%
2020-05-15-1.3%-0.8%
2020-04-28-0.2%-1.3%
2020-04-150.0%-0.2%
2020-03-260.3%0.0%
2020-03-170.3%0.3%
2020-02-280.1%0.3%
2020-02-14-0.2%0.1%
2020-01-29-0.3%-0.2%
2020-01-16-0.2%-0.3%
2019-12-300.5%-0.2%
2019-12-130.6%0.5%
2019-11-260.2%0.6%
2019-11-150.3%0.2%
2019-10-28-0.2%0.3%
2019-10-16-0.2%
2019-09-260.4%
2019-09-130.3%0.4%
2019-08-29-0.2%0.3%
2019-08-15-0.1%-0.2%
2019-07-250-0.1%
15:30
Dallas Fed Services Revenues (Nov) -6,4   -2,5
Opissurvey responses are used to calculate an index for each indicator. Each index is calculated by subtracting the percentage of respondents reporting a decrease from the percentage reporting an increase. When the share of firms reporting an increase exceeds the share of firms reporting a decrease, the index will be greater than zero, suggesting the indicator has increased over the prior month. If the share of firms reporting a decrease exceeds the share reporting an increase, the index will be below zero, suggesting the indicator has decreased over the prior month. An index will be zero when the number of firms reporting an increase is equal to the number of firms reporting a decrease.
PriorytetNiski
DataPoprzednia wartośćKolejna wartośćPrzewidywana wartość
2025-10-28-2.4-6.4
2025-09-308.6-2.4
2025-08-266.38.6
2025-07-29-4.16.3
2025-07-01-4.7-4.1
2025-05-283.8-4.7
2025-04-291.33.8
2025-04-018.21.3
2025-02-255.78.2
2025-01-2813.95.7
2024-12-3110.913.9
2024-11-269.210.9
2024-10-2910.19.2
2024-10-018.710.1
2024-08-277.78.7
2024-07-301.97.7
2024-06-256.71.9
2024-05-290.36.7
2024-04-304.00.3
2024-03-265.24.0
2024-02-27-3.65.2
2024-01-304.0-3.6
2023-12-27-2.44.0
2023-11-280.7-2.4
2023-10-318.70.7
2023-09-2616.28.7
2023-08-2912.916.26.8
2023-08-013.612.95.6
2023-06-276.93.66.0
2023-05-316.96.94.2
2023-04-255.56.94.0
2023-03-286.65.5
2023-02-284.96.6
2023-01-31-0.64.9
2022-12-285.5-0.6
2022-11-298.55.5
2022-11-015.98.5
2022-09-277.25.9
2022-08-309.57.2
2022-07-269.49.5
2022-06-286.39.4
2022-06-0111.26.3
2022-04-2623.411.2
2022-03-2921.923.4
2022-03-012.821.9
2022-02-0120.42.8
2021-12-2825.420.4
2021-11-3019.625.4
2021-10-2614.519.6
2021-09-2816.514.5
2021-08-3121.716.5
2021-07-2716.721.7
2021-06-2923.916.7
2021-06-0226.123.9
2021-04-2721.626.1
2021-03-302.621.6
2021-02-230.82.6
2021-01-265.50.8
2020-12-29-0.75.5
2020-12-017.1-0.7
2020-10-2714.07.1
2020-09-291.514.0
2020-09-01-8.51.5
2020-07-285.7-8.5
2020-06-30-28.15.7
2020-05-27-65.3-28.1
2020-04-28-67.0-65.3
2020-03-3114.0-67.0
2020-02-2518.814.0
2020-01-2817.918.8
2019-12-3112.217.9
2019-11-2615.412.2
2019-10-2912.915.4
2019-10-017.812.9
2019-08-2720.97.8
2019-07-3013.620.9
2019-06-252.713.6
2019-05-2913.92.7
2019-04-3012.813.9
2019-03-2619.212.8
2019-02-2614.919.2
2019-01-2910.114.9
2019-01-0221.410.1
2018-11-2719.421.4
2018-10-3026.919.4
2018-09-2521.526.9
2018-08-2825.421.5
2018-07-3119.025.4
2018-06-2622.819.0
2018-05-3014.722.8
2018-05-0120.014.7
2018-03-2713.220.0
2018-02-2712.813.2
2018-01-3024.412.8
2017-12-2724.424.4
2017-11-2819.224.4
2017-10-3115.919.2
2017-09-2614.215.9
2017-08-2915.714.2
2017-08-0114.815.7
2017-06-2715.914.8
2017-05-3112.115.9
2017-04-2515.212.1
2017-03-2814.115.2
2017-02-2816.214.1
2017-01-3121.316.2
2016-12-2813.721.3
2016-11-299.913.7
2016-11-0113.09.9
2016-09-276.513.0
2016-08-3010.36.5
2016-07-2615.610.3
2016-06-285.815.6
2016-06-0110.65.8
2016-04-266.410.6
2016-03-299.76.4
2016-03-0110.09.7
2016-01-2615.210.0
2015-12-2910.315.2
2015-12-017.610.3
2015-10-2712.87.6
2015-09-299.312.8
2015-09-0119.19.3
2015-07-2813.219.1
2015-06-303.813.2
2015-05-2714.63.8
2015-04-2810.714.6
2015-03-3113.610.7
2015-02-2412.113.6
2015-01-2722.212.1
2014-12-3025.422.2
2014-11-2514.025.4
2014-10-2826.914.0
2014-09-3021.0026.9
2014-08-0119.5021.00
2014-07-0115.7019.50
2014-06-0120.9015.70
2014-05-0118.9020.90
2014-04-0111.0018.90
2014-03-0121.5011.00
2014-02-0116.5021.50
2014-01-0111.8016.50
2013-12-016.0011.80
2013-11-017.306.00
2013-10-0114.207.30
2013-09-0112.9014.20
2013-08-016.8012.90
2013-07-0112.406.80
2013-06-014.9012.40
2013-05-0115.304.90
2013-04-0114.8015.30
2013-03-0110.0014.80
2013-02-0114.4010.00
2013-01-0112.0014.40
2012-12-0116.1012.00
2012-11-0115.0016.10
2012-10-019.6015.00
2012-09-011.409.60
2012-08-0112.001.40
2012-07-0110.5012.00
2012-06-0113.2010.50
2012-05-0115.9013.20
2012-04-0123.3015.90
2012-03-0116.0023.30
2012-02-018.8016.00
2012-01-0115.308.80
2011-12-016.9015.30
2011-11-0113.606.90
2011-10-013.3013.60
2011-09-0110.803.30
2011-08-018.7010.80
2011-07-012.108.70
2011-06-0113.302.10
2011-05-0122.5013.30
2011-04-010.7022.50
2011-03-017.300.70
2011-02-0114.207.30
2011-01-0117.6014.20
2010-12-0121.7017.60
2010-11-015.0021.70
2010-10-017.305.00
2010-09-017.507.30
2010-08-0120.107.50
2010-07-013.5020.10
2010-06-0112.203.50
2010-05-0113.0012.20
2010-04-019.8013.00
2010-03-0111.709.80
2010-02-011.9011.70
2010-01-010.401.90
2009-12-01-1.500.40
2009-11-01-3.80-1.50
2009-10-01-10.30-3.80
2009-09-01-1.10-10.30
2009-08-014.40-1.10
2009-07-01-3.804.40
2009-06-01-4.30-3.80
2009-05-01-15.40-4.30
2009-04-01-12.70-15.40
2009-03-01-16.00-12.70
2009-02-01-18.50-16.00
2009-01-01-16.10-18.50
2008-12-01-14.20-16.10
2008-11-01-8.90-14.20
2008-10-011.80-8.90
2008-09-0110.001.80
2008-08-010.7010.00
2008-07-0111.300.70
2008-06-019.8011.30
2008-05-011.909.80
2008-04-014.001.90
2008-03-0110.904.00
2008-02-0118.3010.90
2008-01-0121.8018.30
2007-12-0128.6021.80
2007-11-0130.2028.60
2007-10-0127.9030.20
2007-09-0122.3027.90
2007-08-0118.6022.30
2007-07-0136.3018.60
2007-06-018.4036.30
2007-05-0127.208.40
2007-04-0124.2027.20
2007-03-0129.3024.20
2007-02-01029.30
15:30
Texas Services Sector Outlook (Nov) -9,4   -2,3
OpisSurvey responses are used to calculate an index for each indicator. Each index is calculated by subtracting the percentage of respondents reporting a decrease from the percentage reporting an increase. When the share of firms reporting an increase exceeds the share of firms reporting a decrease, the index will be greater than zero, suggesting the indicator has increased over the prior month. If the share of firms reporting a decrease exceeds the share reporting an increase, the index will be below zero, suggesting the indicator has decreased over the prior month. An index will be zero when the number of firms reporting an increase is equal to the number of firms reporting a decrease.
PriorytetNiski
DataPoprzednia wartośćKolejna wartośćPrzewidywana wartość
2025-10-28-5.6-9.4
2025-09-306.8-5.6
2025-08-262.06.8
2025-07-29-4.42.0
2025-07-01-10.1-4.4
2025-05-28-19.4-10.1
2025-04-29-11.3-19.4
2025-04-014.6-11.3
2025-02-257.44.6
2025-01-2810.87.4
2024-12-319.810.8
2024-11-262.09.8
2024-10-29-2.62.0
2024-10-01-7.7-2.6
2024-08-27-0.1-7.7
2024-07-30-4.1-0.1
2024-06-25-12.1-4.1
2024-05-29-10.6-12.1
2024-04-30-5.5-10.6
2024-03-26-3.9-5.5
2024-02-27-9.3-3.9
2024-01-30-8.8-9.3
2023-12-27-11.6-8.8
2023-11-28-18.2-11.6
2023-10-31-8.6-18.2
2023-09-26-2.7-8.6
2023-08-29-4.2-2.7-6.1
2023-08-01-8.2-4.2-12.5
2023-06-27-17.3-8.2
2023-05-31-14.4-17.3-16.0
2023-04-25-18.0-14.4-16.0
2023-03-28-9.3-18.0
2023-02-28-15.0-9.3
2023-01-31-20.5-15.0
2022-12-28-11.0-20.5
2022-11-29-13.6-11.0
2022-11-01-5.4-13.6
2022-09-27-5.7-5.4
2022-08-30-10.9-5.7
2022-07-26-12.4-10.9
2022-06-281.5-12.4
2022-06-018.21.5
2022-04-2610.68.2
2022-03-2916.610.6
2022-03-010.616.6
2022-02-0114.20.6
2021-12-2822.714.2
2021-11-3020.722.7
2021-10-268.320.7
2021-09-285.48.3
2021-08-3133.35.4
2021-07-2736.233.3
2021-06-2940.036.2
2021-06-0234.940.0
2021-04-2728.934.9
2021-03-305.028.9
2021-02-23-1.25.0
2021-01-26-2.1-1.2
2020-12-29-2.6-2.1
2020-12-0113.2-2.6
2020-10-2711.513.2
2020-09-294.711.5
2020-09-01-26.74.7
2020-07-282.1-26.7
2020-06-30-41.72.1
2020-05-27-83.9-41.7
2020-04-28-78.8-83.9
2020-03-317.0-78.8
2020-02-2511.17.0
2020-01-2813.511.1
2019-12-314.713.5
2019-11-261.84.7
2019-10-296.31.8
2019-10-010.26.3
2019-08-274.70.2
2019-07-303.24.7
2019-06-25-0.33.2
2019-05-295.7-0.3
2019-04-30-4.45.7
2019-03-262.0-4.4
2019-02-26-4.82.0
2019-01-29-5.0-4.8
2019-01-0211.4-5.0
2018-11-2714.111.4
2018-10-3025.614.1
2018-09-2521.525.6
2018-08-2821.121.5
2018-07-3122.421.1
2018-06-2618.522.4
2018-05-3014.518.5
2018-05-0113.414.5
2018-03-2717.513.4
2018-02-2722.217.5
2018-01-3018.122.2
2017-12-2720.418.1
2017-11-2818.620.4
2017-10-3112.418.6
2017-09-2615.112.4
2017-08-2910.515.1
2017-08-0110.110.5
2017-06-277.710.1
2017-05-319.07.7
2017-04-2513.29.0
2017-03-2815.613.2
2017-02-2821.215.6
2017-01-3119.221.2
2016-12-2812.619.2
2016-11-293.012.6
2016-11-014.73.0
2016-09-27-5.04.7
2016-08-30-1.3-5.0
2016-07-26-7.7-1.3
2016-06-28-7.1-7.7
2016-06-01-3.7-7.1
2016-04-26-3.8-3.7
2016-03-29-19.2-3.8
2016-03-01-10.4-19.2
2016-01-262.3-10.4
2015-12-293.62.3
2015-12-015.63.6
2015-10-273.65.6
2015-09-292.13.6
2015-09-017.92.1
2015-07-284.17.9
2015-06-301.14.1
2015-05-27-1.01.1
2015-04-28-4.6-1.0
2015-03-311.7-4.6
2015-02-24-2.81.7
2015-01-2712.1-2.8
2014-12-3017.312.1
2014-11-2518.017.3
2014-10-2827.518.0
2014-09-3022.8027.5
2014-08-0122.2022.80
2014-07-0111.5022.20
2014-06-0112.3011.50
2014-05-0111.6012.30
2014-04-017.8011.60
2014-03-0119.307.80
2014-02-0113.1019.30
2014-01-0110.0013.10
2013-12-016.2010.00
2013-11-0113.406.20
2013-10-0116.8013.40
2013-09-0114.7016.80
2013-08-0112.5014.70
2013-07-015.3012.50
2013-06-014.305.30
2013-05-0111.004.30
2013-04-017.1011.00
2013-03-017.307.10
2013-02-019.807.30
2013-01-014.709.80
2012-12-017.504.70
2012-11-016.807.50
2012-10-014.706.80
2012-09-012.304.70
2012-08-013.402.30
2012-07-014.603.40
2012-06-0110.604.60
2012-05-0117.0010.60
2012-04-0124.8017.00
2012-03-0119.4024.80
2012-02-018.0019.40
2012-01-018.608.00
2011-12-01-3.708.60
2011-11-01-10.70-3.70
2011-10-01-19.60-10.70
2011-09-01-1.90-19.60
2011-08-01-11.10-1.90
2011-07-011.60-11.10
2011-06-018.401.60
2011-05-0115.208.40
2011-04-0114.8015.20
2011-03-0118.6014.80
2011-02-0118.0018.60
2011-01-0115.4018.00
2010-12-0112.5015.40
2010-11-0110.0012.50
2010-10-010.7010.00
2010-09-01-1.400.70
2010-08-0111.20-1.40
2010-07-0116.6011.20
2010-06-0117.7016.60
2010-05-0111.7017.70
2010-04-010.0011.70
2010-03-013.200.00
2010-02-013.803.20
2010-01-01-1.803.80
2009-12-010.20-1.80
2009-11-01-4.500.20
2009-10-01-1.30-4.50
2009-09-01-13.80-1.30
2009-08-01-13.00-13.80
2009-07-01-11.10-13.00
2009-06-01-11.40-11.10
2009-05-01-33.90-11.40
2009-04-01-45.80-33.90
2009-03-01-41.30-45.80
2009-02-01-47.50-41.30
2009-01-01-46.20-47.50
2008-12-01-41.20-46.20
2008-11-01-30.50-41.20
2008-10-01-12.80-30.50
2008-09-01-17.30-12.80
2008-08-01-18.20-17.30
2008-07-01-13.70-18.20
2008-06-01-21.80-13.70
2008-05-01-29.20-21.80
2008-04-01-12.20-29.20
2008-03-01-17.90-12.20
2008-02-01-4.30-17.90
2008-01-011.40-4.30
2007-12-017.101.40
2007-11-0110.207.10
2007-10-019.7010.20
2007-09-015.609.70
2007-08-015.205.60
2007-07-0110.905.20
2007-06-017.7010.90
2007-05-0114.407.70
2007-04-0123.1014.40
2007-03-0120.8023.10
2007-02-01020.80
16:30
52-Week Bill Auction 3,445%   3,460%
OpisThe figures displayed in the calendar represent the rate on the Treasury Bill auctioned.U.S. Treasury Bills have maturities of a few days to one year. Governments issue treasuries to borrow money to cover the gap between the amount they receive in taxes and the amount they spend to refinance existing debt and/or to raise capital. The rate on a Treasury Bill represents the return an investor will receive by holding the bill for its entire duration. All bidders receive the same rate at the highest accepted bid.Yield fluctuations should be monitored closely as an indicator of the government debt situation. Investors compare the average rate at auction to the rate at previous auctions of the same security.
PriorytetNiski
DataPoprzednia wartośćKolejna wartośćPrzewidywana wartość
2025-10-283.540%3.445%
2025-09-303.660%3.540%
2025-09-023.760%3.660%
2025-08-053.925%3.760%
2025-07-083.940%3.925%
2025-06-103.930%3.940%
2025-05-133.820%3.930%
2025-04-153.945%3.820%
2025-03-184.050%3.945%
2025-02-184.025%4.050%
2025-01-214.070%4.025%
2024-12-234.190%4.070%
2024-11-264.100%4.190%
2024-10-293.780%4.100%
2024-10-014.150%3.780%
2024-09-034.255%4.150%
2024-08-064.775%4.255%
2024-07-094.915%4.775%
2024-06-114.895%4.915%
2024-05-144.915%4.895%
2024-04-164.810%4.915%
2024-03-194.695%4.810%
2024-02-204.570%4.695%
2024-01-234.595%4.570%
2023-12-264.935%4.595%
2023-11-285.135%4.935%
2023-10-315.185%5.135%
2023-10-035.120%5.185%
2023-09-055.060%5.120%
2023-08-085.130%5.060%
2023-07-114.930%5.130%
2023-06-134.645%4.930%
2023-05-164.530%4.645%
2023-04-184.390%4.530%
2023-03-214.795%4.390%
2023-02-214.470%4.795%
2023-01-244.515%4.470%
2022-12-274.555%4.515%
2022-11-294.505%4.555%
2022-11-013.955%4.505%
2022-10-043.460%3.955%
2022-09-063.200%3.460%
2022-08-092.960%3.200%
2022-07-123.020%2.960%
2022-06-142.100%3.020%
2022-05-181.870%2.100%
2022-04-191.590%1.870%
2022-03-221.145%1.590%
2022-02-220.630%1.145%
2022-01-250.390%0.630%
2021-12-280.240%0.390%
2021-11-300.160%0.240%
2021-11-020.090%0.160%
2021-10-050.075%0.090%
2021-09-070.080%0.075%
2021-08-100.075%0.080%
2021-07-130.070%0.075%
2021-06-150.055%0.070%
2021-05-180.065%0.055%
2021-04-200.070%0.065%
2021-03-230.070%0.070%
2021-02-230.090%0.070%
2021-01-260.110%0.090%
2020-12-290.110%0.110%
2020-12-010.135%0.110%
2020-11-030.140%0.135%
2020-10-060.140%0.140%
2020-09-080.140%0.140%
2020-08-110.155%0.140%
2020-07-140.200%0.155%
2020-06-160.160%0.200%
2020-05-190.165%0.160%
2020-04-210.260%0.165%
2020-03-241.270%0.260%
2020-02-251.490%1.270%
2020-01-281.550%1.490%
2019-12-301.525%1.550%
2019-12-031.565%1.525%
2019-11-051.600%1.565%
2019-10-081.740%1.600%
2019-09-101.800%1.740%
2019-08-141.915%1.800%
2019-07-161.985%1.915%
2019-06-182.280%1.985%
2019-05-212.360%2.280%
2019-04-232.360%2.360%
2019-03-262.470%2.360%
2019-02-262.515%2.470%
2019-01-292.545%2.515%
2018-12-312.635%2.545%
2018-12-042.645%2.635%
2018-11-062.580%2.645%
2018-10-092.465%2.580%
2018-09-112.365%2.465%
2018-08-142.335%2.365%
2018-07-172.275%2.335%
2018-06-192.275%2.275%
2018-05-222.200%2.275%
2018-04-242.070%2.200%
2018-03-272.020%2.070%
2018-02-271.830%2.020%
2018-01-301.780%1.830%
2018-01-021.650%1.780%
2017-12-051.485%1.650%
2017-11-071.365%1.485%
2017-10-101.240%1.365%
2017-09-121.230%1.240%
2017-08-151.190%1.230%
2017-07-181.215%1.190%
2017-06-201.145%1.215%
2017-05-231.060%1.145%
2017-04-251.025%1.060%
2017-03-280.850%1.025%
2017-02-280.810%0.850%
2017-01-310.870%0.810%
2017-01-030.830%0.870%
2016-12-060.695%0.830%
2016-11-080.680%0.695%
2016-10-110.630%0.680%
2016-09-130.570%0.630%
2016-08-160.550%0.570%
2016-07-190.560%0.550%
2016-06-210.685%0.560%
2016-05-240.605%0.685%
2016-04-260.660%0.605%
2016-03-290.660%0.660%
2016-03-010.530%0.660%
2016-02-020.670%0.530%
2016-01-050.740%0.670%
2015-12-080.500%0.740%
2015-11-100.205%0.500%
2015-10-140.440%0.205%
2015-09-150.410%0.440%
2015-08-180.330%0.410%
2015-07-210.290%0.330%
2015-06-230.255%0.290%
2015-05-270.245%0.255%
2015-04-280.260%0.245%
2015-03-310.260%0.260%
2015-03-030.205%0.260%
2015-02-030.250%0.205%
2015-01-060.210%0.250%
2014-12-090.140%0.210%
2014-11-120.100%0.140%
2014-10-150.120%0.100%
2014-09-160.105%0.120%
2014-08-190.110%0.105%
2014-07-220.110%0.110%
2014-06-240.095%0.110%
2014-05-280.105%0.095%
2014-04-290.125%0.105%
2014-04-010.120%0.125%
2014-03-040.115%0.120%
2014-02-040.125%0.115%
2014-01-070.135%0.125%
2013-12-100.135%0.135%
2013-11-130.160%0.135%
2013-10-160.120%0.160%
2013-09-170.135%0.120%
2013-08-200.115%0.135%
2013-07-230.160%0.115%
2013-06-250.135%0.160%
2013-05-290.105%0.135%
2013-04-300.140%0.105%
2013-04-020.150%0.140%
2013-03-050.145%0.150%
2013-02-050.140%0.145%
2013-01-080.160%0.140%
2012-12-110.180%0.160%
2012-11-140.180%0.180%
2012-10-160.175%0.180%
2012-09-180.195%0.175%
2012-08-210.175%0.195%
2012-07-240.205%0.175%
2012-06-260.185%0.205%
2012-05-300.185%0.185%
2012-05-010.185%0.185%
2012-04-030.170%0.185%
2012-03-010.11%0.170%
2012-02-010.11%0.11%
2012-01-010.10%0.11%
2011-12-010.12%0.10%
2011-11-010.09%0.12%
2011-10-010.10%0.09%
2011-09-010.20%0.10%
2011-08-0100.20%
17:00
Atlanta Fed GDPNow (Q4) 4,2% 4,2% 4,0%
OpisGDPNow is not an official forecast of the Atlanta Fed. Rather, it is best viewed as a running estimate of real GDP growth based on available economic data for the current measured quarter. There are no subjective adjustments made to GDPNow—the estimate is based solely on the mathematical results of the model. In particular, it does not capture the impact of COVID-19 and social mobility beyond their impact on GDP source data and relevant economic reports that have already been released. It does not anticipate their impact on forthcoming economic reports beyond the standard internal dynamics of the model.
Priorytet Średni
DataPoprzednia wartośćKolejna wartośćPrzewidywana wartość
2025-09-263.3%3.9%3.3%
2025-09-173.4%3.3%3.4%
2025-09-163.1%3.4%3.1%
2025-09-103.0%3.1%3.0%
2025-09-043.0%3.0%3.0%
2025-09-023.5%3.0%3.5%
2025-08-292.2%3.5%2.2%
2025-08-262.3%2.2%2.3%
2025-08-192.5%2.3%2.5%
2025-08-152.5%2.5%2.5%
2025-08-072.5%2.5%2.5%
2025-08-052.1%2.5%2.1%
2025-08-012.3%2.1%2.3%
2025-07-312.3%
2025-07-292.4%2.4%
2025-07-252.4%2.4%2.4%
2025-07-182.4%2.4%2.4%
2025-07-172.6%2.4%2.6%
2025-07-092.6%2.6%2.6%
2025-07-032.5%2.6%2.5%
2025-07-012.9%2.5%2.9%
2025-06-273.4%2.9%3.4%
2025-06-183.5%3.4%3.5%
2025-06-173.8%3.5%3.8%
2025-06-093.8%3.8%3.8%
2025-06-054.6%3.8%4.6%
2025-06-023.8%4.6%3.8%
2025-05-302.2%3.8%2.2%
2025-05-272.4%2.2%2.4%
2025-05-162.5%2.4%2.5%
2025-05-152.3%2.5%2.3%
2025-05-082.2%2.3%2.2%
2025-05-061.1%2.2%1.1%
2025-05-012.4%1.1%2.4%
2025-04-302.4%
2025-04-29-2.5%-2.5%
2025-04-24-2.2%-2.5%-2.2%
2025-04-17-2.2%-2.2%-2.2%
2025-04-16-2.8%-2.2%-2.8%
2025-04-03-3.7%-2.8%-3.7%
2025-04-01-2.8%-3.7%-2.8%
2025-03-28-1.8%-2.8%-1.8%
2025-03-26-1.8%-1.8%-1.8%
2025-03-18-2.1%-1.8%-2.1%
2025-03-17-2.4%-2.1%-2.4%
2025-03-06-2.8%-2.4%-2.8%
2025-03-03-1.5%-2.8%-1.5%
2025-02-282.3%-1.5%2.3%
2025-02-192.3%2.3%2.3%
2025-02-142.9%2.3%2.9%
2025-02-072.9%2.9%2.9%
2025-02-053.9%2.9%3.9%
2025-02-032.9%3.9%2.9%
2025-01-312.9%
2025-01-293.2%3.2%
2025-01-283.0%3.2%3.0%
2025-01-173.0%3.0%3.0%
2025-01-162.7%3.0%2.7%
2025-01-092.7%2.7%2.7%
2025-01-072.4%2.7%2.4%
2025-01-032.6%2.4%2.6%
2025-01-023.1%2.6%3.1%
2024-12-243.1%3.1%3.1%
2024-12-203.2%3.1%3.2%
2024-12-183.1%3.2%3.1%
2024-12-173.3%3.1%3.3%
2024-12-093.3%3.3%3.3%
2024-12-053.2%3.3%3.2%
2024-12-022.7%3.2%2.7%
2024-11-272.6%2.7%2.6%
2024-11-192.5%2.6%2.5%
2024-11-152.5%2.5%2.5%
2024-11-072.4%2.5%2.4%
2024-11-052.3%2.4%2.3%
2024-11-012.7%2.3%2.7%
2024-10-312.7%
2024-10-293.3%3.3%
2024-10-253.4%3.3%3.4%
2024-10-183.4%3.4%3.4%
2024-10-173.2%3.4%3.2%
2024-10-093.2%3.2%3.2%
2024-10-082.5%3.2%2.5%
2024-10-013.1%2.5%3.1%
2024-09-272.9%3.1%2.9%
2024-09-183.0%2.9%3.0%
2024-09-172.5%3.0%2.5%
2024-09-092.1%2.5%2.1%
2024-09-042.0%2.1%2.0%
2024-09-032.5%2.0%2.5%
2024-08-302.0%2.5%2.0%
2024-08-262.0%2.0%2.0%
2024-08-162.4%2.0%2.4%
2024-08-152.9%2.4%2.9%
2024-08-082.9%2.9%2.9%
2024-08-062.5%2.9%2.5%
2024-08-012.8%2.5%2.8%
2024-07-262.8%
2024-07-242.7%2.7%
2024-07-172.5%2.7%2.5%
2024-07-162.0%2.5%2.0%
2024-07-101.5%2.0%1.5%
2024-07-031.7%1.5%1.7%
2024-07-012.2%1.7%2.2%
2024-06-282.7%2.2%2.7%
2024-06-273.0%2.7%3.0%
2024-06-203.1%3.0%3.1%
2024-06-183.1%3.1%3.1%
2024-06-072.6%3.1%2.6%
2024-06-061.8%2.6%1.8%
2024-06-032.7%1.8%2.7%
2024-05-313.5%2.7%3.5%
2024-05-243.6%3.5%3.6%
2024-05-163.8%3.6%3.8%
2024-05-154.2%3.8%4.2%
2024-05-083.3%4.2%3.3%
2024-05-023.3%3.3%3.3%
2024-05-013.9%3.3%3.9%
2024-04-263.9%
2024-04-242.9%2.9%
2024-04-162.8%2.9%2.8%
2024-04-152.4%2.8%2.4%
2024-04-102.5%2.4%2.5%
2024-04-042.8%2.5%2.8%
2024-04-012.3%2.8%2.3%
2024-03-292.1%2.3%2.1%
2024-03-262.1%2.1%2.1%
2024-03-192.3%2.1%2.3%
2024-03-142.5%2.3%2.5%
2024-03-072.5%2.5%2.5%
2024-03-062.1%2.5%2.1%
2024-03-013.0%2.1%3.0%
2024-02-293.2%3.0%3.2%
2024-02-272.9%3.2%2.9%
2024-02-162.9%2.9%2.9%
2024-02-153.4%2.9%3.4%
2024-02-083.4%3.4%3.4%
2024-02-074.2%3.4%4.2%
2024-02-013.0%4.2%3.0%
2024-01-263.0%
2024-01-192.4%2.4%
2024-01-182.4%2.4%2.4%
2024-01-172.2%2.4%2.2%
2024-01-102.2%2.2%2.2%
2024-01-092.5%2.2%2.5%
2024-01-032.0%2.5%2.0%
2024-01-022.3%2.0%2.3%
2023-12-222.7%2.3%2.7%
2023-12-192.6%2.7%2.6%
2023-12-141.2%2.6%1.2%
2023-12-071.3%1.2%1.3%
2023-12-061.2%1.3%1.2%
2023-12-011.8%1.2%1.8%
2023-11-302.1%1.8%2.1%
2023-11-222.0%2.1%2.0%
2023-11-172.2%2.0%2.2%
2023-11-152.1%2.2%2.1%
2023-11-082.1%2.1%2.1%
2023-11-071.2%2.1%1.2%
2023-11-012.3%1.2%2.3%
2023-10-2702.3%
18:00
5-Year Note Auction 3,625%   3,562%
OpisThe figures displayed in the calendar represent the yield on the Treasury Note auctioned.U.S. Treasury Notes have maturities of two to ten years. Governments issue treasuries to borrow money to cover the gap between the amount they receive in taxes and the amount they spend to refinance existing debt and/or to raise capital. The rate on a Treasury Note represents the return an investor will receive by holding the note for its entire duration. All bidders receive the same rate at the highest accepted bid.Yield fluctuations should be monitored closely as an indicator of the government debt situation. Investors compare the average rate at auction to the rate at previous auctions of the same security.
Priorytet Średni
DataPoprzednia wartośćKolejna wartośćPrzewidywana wartość
2025-10-273.710%3.625%
2025-09-243.724%3.710%
2025-08-273.983%3.724%
2025-07-283.879%3.983%
2025-06-254.071%3.879%
2025-05-283.995%4.071%
2025-04-234.100%3.995%
2025-03-264.123%4.100%
2025-02-254.330%4.123%
2025-01-274.478%4.330%
2024-12-244.197%4.478%
2024-11-264.138%4.197%
2024-10-283.519%4.138%
2024-09-253.645%3.519%
2024-08-284.121%3.645%
2024-07-244.331%4.121%
2024-06-264.553%4.331%
2024-05-284.659%4.553%
2024-04-244.235%4.659%
2024-03-264.320%4.235%
2024-02-264.055%4.320%
2024-01-243.801%4.055%
2023-12-274.420%3.801%
2023-11-274.899%4.420%
2023-10-254.659%4.899%
2023-09-274.400%4.659%
2023-08-284.170%4.400%
2023-07-254.019%4.170%
2023-06-273.749%4.019%
2023-05-243.500%3.749%
2023-04-263.665%3.500%
2023-03-284.109%3.665%
2023-02-223.530%4.109%
2023-01-253.973%3.530%
2022-12-283.974%3.973%
2022-11-214.192%3.974%
2022-10-264.228%4.192%
2022-09-273.230%4.228%
2022-08-242.860%3.230%
2022-07-263.271%2.860%
2022-06-272.736%3.271%
2022-05-252.785%2.736%
2022-04-272.543%2.785%
2022-03-281.880%2.543%
2022-02-231.533%1.880%
2022-01-251.263%1.533%
2021-12-281.319%1.263%
2021-11-221.157%1.319%
2021-10-270.990%1.157%
2021-09-270.831%0.990%
2021-08-250.710%0.831%
2021-07-270.904%0.710%
2021-06-230.788%0.904%
2021-05-260.849%0.788%
2021-04-260.850%0.849%
2021-03-240.621%0.850%
2021-02-240.424%0.621%
2021-01-260.394%0.424%
2020-12-280.397%0.394%
2020-11-230.330%0.397%
2020-10-280.275%0.330%
2020-09-230.298%0.275%
2020-08-260.288%0.298%
2020-07-270.330%0.288%
2020-06-240.334%0.330%
2020-05-270.394%0.334%
2020-04-270.535%0.394%
2020-03-251.150%0.535%
2020-02-261.448%1.150%
2020-01-271.756%1.448%
2019-12-241.587%1.756%
2019-11-261.570%1.587%
2019-10-231.600%1.570%
2019-09-251.365%1.600%
2019-08-281.824%1.365%
2019-07-241.791%1.824%
2019-06-262.065%1.791%
2019-05-282.315%2.065%
2019-04-242.172%2.315%
2019-03-272.489%2.172%
2019-02-252.576%2.489%
2019-01-282.652%2.576%
2018-12-262.880%2.652%
2018-11-272.997%2.880%
2018-10-242.997%2.997%
2018-09-252.765%2.997%
2018-08-282.815%2.765%
2018-07-252.719%2.815%
2018-06-272.864%2.719%
2018-05-232.837%2.864%
2018-04-252.612%2.837%
2018-03-272.658%2.612%
2018-02-212.434%2.658%
2018-01-242.245%2.434%
2017-12-272.066%2.245%
2017-11-272.058%2.066%
2017-10-251.911%2.058%
2017-09-271.742%1.911%
2017-08-281.884%1.742%
2017-07-261.828%1.884%
2017-06-271.831%1.828%
2017-05-241.875%1.831%
2017-04-261.950%1.875%
2017-03-281.937%1.950%
2017-02-221.988%1.937%
2017-01-252.057%1.988%
2016-12-281.760%2.057%
2016-11-221.303%1.760%
2016-10-261.129%1.303%
2016-09-271.125%1.129%
2016-08-241.180%1.125%
2016-07-261.218%1.180%
2016-06-211.395%1.218%
2016-05-251.410%1.395%
2016-04-261.335%1.410%
2016-03-291.169%1.335%
2016-02-241.496%1.169%
2016-01-271.785%1.496%
2015-12-291.670%1.785%
2015-11-241.415%1.670%
2015-10-281.467%1.415%
2015-09-231.463%1.467%
2015-08-261.625%1.463%
2015-07-291.710%1.625%
2015-06-241.560%1.710%
2015-05-271.380%1.560%
2015-04-281.387%1.380%
2015-03-251.480%1.387%
2015-02-251.288%1.480%
2015-01-291.739%1.288%
2014-12-231.595%1.739%
2014-11-251.567%1.595%
2014-10-291.800%1.567%
2014-09-241.646%1.800%
2014-08-271.720%1.646%
2014-07-291.670%1.720%
2014-06-251.513%1.670%
2014-05-281.732%1.513%
2014-04-231.715%1.732%
2014-03-261.530%1.715%
2014-02-261.572%1.530%
2014-01-301.600%1.572%
2013-12-181.340%1.600%
2013-11-261.300%1.340%
2013-10-291.436%1.300%
2013-09-251.624%1.436%
2013-08-281.410%1.624%
2013-07-241.484%1.410%
2013-06-261.045%1.484%
2013-05-290.710%1.045%
2013-04-240.760%0.710%
2013-03-270.777%0.760%
2013-02-260.889%0.777%
2013-01-290.769%0.889%
2012-12-180.641%0.769%
2012-11-280.774%0.641%
2012-10-240.647%0.774%
2012-09-260.708%0.647%
2012-08-290.584%0.708%
2012-07-250.752%0.584%
2012-06-270.748%0.752%
2012-05-230.887%0.748%
2012-04-251.040%0.887%
2012-03-280.900%1.040%
2012-02-220.899%0.900%0.901%
2012-01-250.880%0.899%
2011-12-011.00%0.880%
2011-11-011.00%1.00%
2011-10-011.00%1.00%
2011-09-011.50%1.00%
2011-08-011.50%1.50%
2011-07-011.75%1.50%
2011-06-012.00%1.75%
2011-05-012.25%2.00%
2011-04-012.13%2.25%
2011-03-012.00%2.13%
2011-02-012.13%2.00%
2011-01-011.38%2.13%
2010-12-011.25%1.38%
2010-11-011.25%1.25%
2010-10-011.13%1.25%
2010-09-011.75%1.13%
2010-08-011.88%1.75%
2010-07-012.14%1.88%
2010-06-012.50%2.14%
2010-05-012.50%2.50%
2010-04-012.38%2.50%
2010-03-012.25%2.38%
2010-02-012.63%2.25%
2010-01-012.13%2.63%
2009-12-012.38%2.13%
2009-11-012.38%2.38%
2009-10-012.38%2.38%
2009-09-012.63%2.38%
2009-08-012.63%2.63%
2009-07-010.06%2.63%
2009-06-011.88%0.06%
2009-05-011.75%1.88%
2009-04-011.88%1.75%
2009-03-011.75%1.88%
2009-02-011.50%1.75%
2009-01-012.00%1.50%
2008-12-012.75%2.00%
2008-11-013.13%2.75%
2008-09-013.38%3.13%
2008-07-013.50%3.38%
2008-06-013.13%3.50%
2008-05-012.50%3.13%
2008-04-012.75%2.50%
2008-03-012.88%2.75%
2008-02-013.63%2.88%
2008-01-013.38%3.63%
2007-12-013.88%3.38%
2007-11-014.25%3.88%
2007-10-014.13%4.25%
2007-09-014.63%4.13%
2007-08-014.88%4.63%
2007-07-014.75%4.88%
2007-06-014.50%4.75%
2007-05-014.50%4.50%
2007-04-014.63%4.50%
2007-03-014.75%4.63%
2007-02-014.63%4.75%
2007-01-014.50%4.63%
2006-12-014.63%4.50%
2006-11-014.50%4.63%
2006-10-014.63%4.50%
2006-09-014.88%4.63%
2006-08-015.13%4.88%
2006-07-014.88%5.13%
2006-06-014.88%4.88%
2006-05-014.75%4.88%
2006-04-014.50%4.75%
2006-03-014.25%4.50%
2006-02-014.38%4.25%
2006-01-014.50%4.38%
2005-12-014.25%4.50%
2005-11-013.88%4.25%
2005-10-014.13%3.88%
2005-09-013.88%4.13%
2005-08-013.63%3.88%
2005-07-013.88%3.63%
2005-06-014.00%3.88%
2005-05-014.00%4.00%
2005-04-013.50%4.00%
2005-03-013.63%3.50%
2005-02-013.50%3.63%
2005-01-013.50%3.50%
2004-12-013.38%3.50%
2004-11-013.38%3.38%
2004-10-013.50%3.38%
2004-09-013.63%3.50%
2004-08-014.00%3.63%
2004-07-013.88%4.00%
2004-06-013.13%3.88%
2004-05-012.63%3.13%
2004-04-013.00%2.63%
2004-03-013.25%3.00%
2004-02-013.38%3.25%
2004-01-013.38%3.38%
2003-12-013.13%3.38%
2003-11-013.13%3.13%
2003-10-013.25%3.13%
2003-09-012.63%3.25%
2003-07-012.63%2.63%
2003-06-013.00%2.63%
2003-03-013.00%3.00%
2002-12-013.25%3.00%
2002-09-014.38%3.25%
2002-06-013.50%4.38%
2002-03-013.50%3.50%
2001-12-014.63%3.50%
2001-09-014.63%4.63%
2001-06-015.75%4.63%
2001-03-015.75%5.75%
2000-12-016.75%5.75%
2000-09-016.75%6.75%
2000-06-015.88%6.75%
2000-03-015.88%5.88%
1999-12-016.00%5.88%
1999-09-015.25%6.00%
1999-06-014.75%5.25%
1999-03-014.25%4.75%
1998-12-015.25%4.25%
1998-09-015.38%5.25%
1998-07-015.50%5.38%
1998-06-015.75%5.50%
1998-05-015.50%5.75%
1998-04-015.50%5.50%
1998-03-015.50%5.50%
1998-02-015.63%5.50%
1998-01-015.75%5.63%
1997-12-015.75%5.75%
1997-11-015.88%5.75%
1997-10-016.25%5.88%
1997-09-016.00%6.25%
1997-08-016.25%6.00%
1997-07-0106.25%
18:00
M2 Money Supply (MoM) (Oct) 22,21T   22,30T
OpisUS M2 Money Stock refers to the measure of money supply that includes financial assets held mainly by households. These include savings deposits, time deposits, and balances in retail money market mutual funds, in addition to more readily-available liquid financial assets as defined by the M1 measure of money, such as currency, traveler's checks, demand deposits, and other checkable deposits. The US M2 Money Stock is critical in understanding and forecasting money supply, inflation, and interest rates in the US. Historically, when the money supply dramatically increased in global economies, there would be a following dramatic increase in prices of goods and services, which would then follow monetary policy with the aim to maintain inflation levels low.
PriorytetNiski
DataPoprzednia wartośćKolejna wartośćPrzewidywana wartość
2025-10-2822.11T22.21T
2025-09-2322.12T22.11T
2025-08-2622.02T22.12T
2025-07-2221.94T22.02T
2025-06-2421.86T21.94T
2025-05-2721.76T21.86T
2025-04-2221.67T21.76T
2025-03-2521.56T21.67T
2025-02-2521.53T21.56T
2025-01-2821.45T21.53T
2024-12-2621.34T21.45T
2024-11-2621.22T21.34T
2024-10-2221.18T21.22T
2024-09-2421.05T21.18T
2024-08-2721.03T21.05T
2024-07-2320.96T21.03T
2024-06-2520.87T20.96T
2024-05-2820.84T20.87T
2024-04-2320.78T20.84T
2024-03-2620.78T20.78T
2024-02-2720.83T20.78T
2024-01-2320.77T20.83T
2023-12-2620.73T20.77T
2023-11-2820.76T20.73T
2023-10-2420.83T20.76T
2023-09-2620.91T20.83T
2023-08-2220.81T20.91T
2023-07-2520.67T20.81T
2023-06-2720.84T20.67T
2023-05-2321.08T20.84T
2023-04-2521.18T21.08T
2023-03-2821.33T21.18T
2023-02-2821.38T21.33T
2023-01-2421.42T21.38T
2022-12-2721.43T21.42T
2022-11-2921.52T21.43T
2022-10-2521.66T21.52T
2022-09-2721.70T21.66T
2022-08-2321.64T21.70T
2022-07-3121.61T21.64T
2022-06-3021.65T21.61T
2022-05-3121.64T21.65T
2022-04-3021.74T21.64T
2022-03-3121.71T21.74T
2022-02-2821.7T21.71T
2022-01-3121.5T21.7T
2021-12-3121.4T21.5T
2021-11-3021.2T21.4T
2021-10-3121.0T21.2T
2021-09-3020.8T21.0T
2021-08-3120.6T20.8T
2021-07-3120.4T20.6T
2021-06-3020.4T20.4T
2021-05-3120.1T20.4T
2021-04-3019.9T20.1T
2021-03-3119.7T19.9T
2021-02-2819.4T19.7T
2021-01-3119.1T19.4T
2020-12-3118.8T19.1T
2020-10-3118.6T18.8T
2020-09-3018.4T18.6T
2020-08-3118.3T18.4T
2020-07-3118.2T18.3T
2020-06-3017.9T18.2T
2020-05-3117.0T17.9T
2020-04-3016.0T17.0T
2020-03-3115.5T16.0T
2020-02-2915.4T15.5T
2020-01-3115.3T15.4T
2019-12-3115.3T15.3T
2019-11-3015.2T15.3T
2019-10-3115.0T15.2T
2019-09-3014.9T15.0T
2019-08-3114.9T14.9T
2019-07-3114.8T14.9T
2019-06-3014.7T14.8T
2019-05-3114.6T14.7T
2019-04-3014.5T14.6T
2019-03-3114.5T14.5T
2019-02-2814.5T14.5T
2019-01-3114.4T14.5T
2018-12-3114.3T14.4T
2018-11-3014.3T14.3T
2018-10-3114.2T14.3T
2018-09-3014.2T14.2T
2018-08-3114.2T14.2T
2018-07-3114.1T14.2T
2018-06-3014.1T14.1T
2018-05-3114.0T14.1T
2018-04-3014.0T14.0T
2018-03-3113.9T14.0T
2018-02-2813.9T13.9T
2018-01-31013.9T
19:00
Economic Activity (YoY) (Sep) 2,4% 2,1%  
OpisThe Instituto Nacional de Estadística y Censos (INDEC) Economy Activity Index provides an early estimate for real gross domestic (GDP) performance in Argentina.A higher than expected reading should be taken as positive/bullish for the ARS, while a lower than expected reading should be taken as negative/bearish for the ARS.
PriorytetNiski
DataPoprzednia wartośćKolejna wartośćPrzewidywana wartość
2025-10-222.9%2.4%2.5%
2025-09-246.4%2.9%3.3%
2025-08-205.0%6.4%6.4%
2025-07-218.0%5.0%5.8%
2025-06-305.6%8.0%6.6%
2025-05-215.7%5.6%6.4%
2025-04-226.5%5.7%
2025-03-275.5%6.5%4.7%
2025-02-250.1%5.5%3.5%
2025-01-23-0.7%0.1%-0.1%
2024-12-20-3.3%-0.7%-2.2%
2024-11-22-3.8%-3.3%-2.7%
2024-10-23-1.3%-3.8%-4.9%
2024-09-25-3.9%-1.3%-4.1%
2024-08-212.3%-3.9%-1.9%
2024-07-18-1.7%2.3%-2.4%
2024-06-28-8.4%-1.7%-4.0%
2024-05-22-3.2%-8.4%
2024-04-23-4.3%-3.2%
2024-03-26-4.5%-4.3%-5.7%
2024-02-22-0.9%-4.5%-2.3%
2024-01-230.6%-0.9%-0.8%
2023-12-21-0.7%0.6%-0.8%
2023-11-220.3%-0.7%-0.5%
2023-10-24-1.3%0.3%-2.5%
2023-09-26-4.4%-1.3%-3.7%
2023-08-23-5.5%-4.4%-4.0%
2023-07-18-4.2%-5.5%-3.2%
2023-06-301.4%-4.2%-1.5%
2023-05-230.2%1.4%-0.2%
2023-04-242.9%0.2%-1.0%
2023-03-29-1.0%2.9%0.2%
2023-02-232.6%-1.0%1.0%
2023-01-244.5%2.6%3.4%
2022-12-214.8%4.5%4.5%
2022-11-236.4%4.8%4.3%
2022-10-205.6%6.4%4.2%
2022-09-266.4%5.6%4.7%
2022-08-237.6%6.4%6.0%
2022-07-205.1%7.6%7.4%
2022-06-304.8%5.1%6.5%
2022-05-198.5%4.8%5.9%
2022-04-215.4%8.5%6.6%
2022-03-299.8%5.4%6.7%
2022-02-239.3%9.8%8.5%
2022-01-256.7%9.3%7.4%
2021-12-2311.4%6.7%7.9%
2021-11-2312.8%11.4%9.0%
2021-10-2111.7%12.8%8.3%
2021-09-2810.8%11.7%8.7%
2021-08-1913.6%10.8%16.0%
2021-07-2128.3%13.6%16.0%
2021-06-2911.9%28.3%30.5%
2021-05-20-2.1%11.9%9.1%
2021-04-22-2.0%-2.1%-2.0%
2021-03-30-2.2%-2.0%-3.0%
2021-02-24-3.7%-2.2%-3.0%
2021-01-26-7.3%-3.7%-3.3%
2020-12-23-6.3%-7.3%-8.5%
2020-11-24-11.6%-6.3%-9.0%
2020-10-22-13.2%-11.6%-12.0%
2020-09-28-11.7%-13.2%-14.9%
2020-08-20-20.6%-11.7%-14.0%
2020-07-22-26.4%-20.6%-20.3%
2020-06-29-11.5%-26.4%-21.0%
2020-05-20-2.2%-11.5%-8.7%
2020-04-28-1.8%-2.2%-3.4%
2020-03-30-0.3%-1.8%-1.9%
2020-02-21-1.9%-0.3%-1.9%
2020-01-230.9%-1.9%-2.0%
2019-12-23-2.1%0.9%
2019-11-26-3.8%-2.1%
2019-10-240.6%-3.8%-3.5%
2019-09-260.0%0.6%-1.8%
2019-08-222.4%0.0%0.1%
2019-07-25-1.3%2.4%0.1%
2019-06-26-6.8%-1.3%-3.0%
2019-05-22-4.8%-6.8%-6.0%
2019-04-300.1%-4.8%-5.3%
2019-03-28-7.0%0.1%
2019-02-27-7.5%-7.0%-6.9%
2019-01-24-4.0%-7.5%-6.2%
2018-12-27-5.8%-4.0%-3.6%
2018-11-23-1.6%-5.8%-2.4%
2018-10-25-2.7%-1.6%-2.4%
2018-09-26-6.7%-2.7%-3.1%
2018-08-23-5.8%-6.7%-3.1%
2018-07-24-0.9%-5.8%-1.3%
2018-06-261.4%-0.9%2.3%
2018-05-225.1%1.4%2.8%
2018-04-244.1%5.1%4.6%
2018-03-282.0%4.1%3.1%
2018-02-283.9%2.0%2.5%
2018-01-245.2%3.9%3.8%
2017-12-273.8%5.2%5.0%
2017-11-234.3%3.8%4.0%
2017-10-244.9%4.3%4.1%
2017-09-274.0%4.9%4.5%
2017-08-243.3%4.0%4.2%
2017-07-250.6%3.3%3.1%
2017-06-280.8%0.6%1.9%
2017-05-23-2.2%0.8%1.0%
2017-04-251.1%-2.2%0.4%
2017-03-28-0.1%1.1%-1.0%
2017-02-24-1.4%-0.1%-0.6%
2017-01-26-4.7%-1.4%-2.4%
2016-12-27-3.7%-4.7%-3.9%
2016-11-24-2.6%-3.7%-3.5%
2016-10-25-5.9%-2.6%-2.7%
2016-09-27-4.3%-5.9%-4.0%
2016-08-242.8%-4.3%-3.0%
2016-01-182.8%2.8%2.4%
2015-10-262.7%2.8%2.0%
2015-09-253.8%2.7%4.7%
2015-08-212.2%3.8%2.1%
2015-07-241.7%2.2%1.0%
2015-06-262.0%1.7%1.3%
2015-05-261.4%2.0%1.5%
2015-04-240.0%1.4%0.5%
2015-03-270.6%0.0%0.5%
2015-02-270.2%0.6%0.2%
2015-01-230.1%0.2%0.1%
2014-12-29-0.2%0.1%-1.1%
2014-11-21-1.2%-0.2%-0.8%
2014-10-230.0%-1.2%-0.5%
2014-09-260.7%0.0%-0.2%
2014-08-20-0.2%0.7%-0.5%
2014-07-24-0.5%-0.2%-1.0%
2014-06-30-0.9%-0.5%-1.0%
2014-05-161.3%-0.9%1.0%
2014-04-221.2%1.3%
2014-03-272.7%1.2%1.6%
2014-02-212.2%2.7%1.5%
2014-01-173.2%2.2%2.7%
2013-12-274.7%3.2%3.5%
2013-11-154.0%4.7%4.2%
2013-10-185.1%4.0%3.1%
2013-09-276.4%5.1%5.2%
2013-08-167.8%6.4%6.0%
2013-07-197.0%7.8%6.1%
2013-06-272.9%7.0%4.8%
2013-05-172.3%2.9%2.3%
2013-04-193.2%2.3%2.0%
2013-03-221.2%3.2%1.7%
2013-02-151.8%1.2%1.5%
2013-01-183.0%1.8%1.8%
2012-12-280.1%3.0%0.5%
2012-11-161.4%0.1%1.6%
2012-10-192.7%1.4%2.0%
2012-09-280.0%2.7%0.5%
2012-08-17-0.5%0.0%-0.3%
2012-07-200.6%-0.5%-0.5%
2012-06-154.0%0.6%3.0%
2012-05-185.2%4.0%5.0%
2012-04-205.5%5.2%5.4%
2012-03-265.5%5.5%4.4%
2012-02-177.6%5.5%6.8%
2012-01-208.2%7.6%6.6%
2011-12-228.9%8.2%6.5%
2011-11-188.6%8.9%7.8%
2011-10-187.7%8.6%6.8%
2011-09-239.4%7.7%7.4%
2011-08-198.1%9.4%6.8%
2011-07-187.1%8.1%7.5%
2011-06-248.7%7.1%7.5%
2011-05-208.7%8.7%8.3%
2011-04-189.5%8.7%8.6%
2011-03-2810.1%9.5%8.7%
2011-02-189.8%10.1%8.2%
2011-01-217.2%9.8%7.9%
2010-12-2207.2%7.4%
21:00
Manufacturing BSI Index 68    
OpisBSI is conducted to investigate overall business trend by surveying how the companies feel on current business and future tendency. A reading below 100 means the number of companies that see business conditions deteriorating in the month in question outnumber those that see an improvement.A higher than expected reading should be taken as positive/bullish for the KRW , while a lower than expected reading should be taken as negative/bearish for the KRW.
PriorytetNiski
DataPoprzednia wartośćKolejna wartośćPrzewidywana wartość
2025-10-287068
2025-09-257070
2025-08-266870
2025-07-237068
2025-06-257370
2025-05-276873
2025-03-256568
2025-02-206365
2025-01-226263
2024-12-266862
2024-11-266968
2024-10-236969
2024-09-267169
2024-08-207371
2024-07-247873
2024-06-267478
2024-05-217174
2024-04-247471
2024-03-267674
2024-02-207276
2024-01-247272
2023-12-277272
2023-11-287172
2023-10-256871
2023-09-266768
2023-08-22726772
2023-07-266972
2023-06-28706971
2023-05-23687072
2023-04-26676868
2023-03-296567
2023-02-21666565
2023-01-267166
2022-12-277471
2022-11-227574
2022-10-257375
2022-09-288273
2022-08-238082
2022-07-278280
2022-06-298582
2022-05-248585
2022-04-278385
2022-03-309183
2022-02-229391
2022-01-268993
2021-12-288889
2021-11-238788
2021-10-289287
2021-09-299492
2021-08-249694
2021-07-2910196
2021-06-2498101
2021-05-25959898
2021-04-289195
2021-03-308391
2021-02-238483
2021-01-277684
2020-12-298476
2020-11-247884
2020-10-287078
2020-09-286870
2020-08-256068
2020-07-295160
2020-06-294551
2020-05-264545
2020-04-285245
2020-03-306652
2020-02-257966
2020-01-29757974
2019-12-307475
2019-11-277474
2019-10-287374
2019-09-307173
2019-08-287471
2019-07-297674
2019-06-267276
2019-05-287372
2019-04-297573
2019-03-277475
2019-02-266774
2019-01-297267
2018-12-277472
2018-11-277474
2018-10-297874
2018-10-017678
2018-08-297476
2018-07-308174
2018-06-287681
2018-05-307776
2018-04-267677
2018-03-287976
2018-02-278079
2018-01-298380
2017-12-278483
2017-11-278784
2017-10-307987
2017-09-288479
2017-08-288184
2017-07-278181
2017-06-288281
2017-05-307982
2017-04-277879
2017-03-287978
2017-02-277879
2017-01-257378
2016-12-287473
2016-11-287474
2016-10-277674
2016-09-297776
2016-08-307377
2016-07-287273
2016-06-287272
2016-05-296972
2016-04-286669
2016-03-306566
2016-02-286765
2016-01-287167
2015-12-297271
2015-11-297272
2015-10-297072
2015-09-297370
2015-08-307373
2015-07-306773
2015-06-297467
2015-05-287674
2015-04-287676
2015-03-297976
2015-02-267479
2015-01-298074
2014-12-288080
2014-11-277680
2014-10-297876
2014-09-297578
2014-08-288075
2014-07-2978.0080
2014-06-2977.0078.00
2014-05-2979.0077.00
2014-04-2980.0079.00
2014-03-2782.0080.00
2014-02-2784.0082.00
2014-01-2784.0084.00
2013-12-2682.0084.00
2013-11-2686.0082.00
2013-10-2982.0086.00
2013-09-2978.0082.00
2013-08-2774.0078.00
2013-07-2876.0074.00
2013-06-2578.0076.00
2013-05-2975.0078.00
2013-04-2977.0075.00
2013-03-2875.0077.00
2013-02-2776.0075.00
2013-01-2873.0076.00
2012-12-2669.0073.00
2012-11-2872.0069.00
2012-10-2870.0072.00
2012-09-2673.0070.00
2012-08-2969.0073.00
2012-07-2981.0069.00
2012-06-2682.0081.00
2012-05-2884.0082.00
2012-04-2984.0084.00
2012-03-0184.0084.00
2012-02-0188.0084.00
2012-01-0187.0088.00
2011-12-0189.0087.00
2011-11-0189.0089.00
2011-10-0196.0089.00
2011-09-0192.0096.00
2011-08-0194.0092.00
2011-07-0194.0094.00
2011-06-0194.0094.00
2011-05-0196.0094.00
2011-04-0197.0096.00
2011-03-0199.0097.00
2011-02-0197.0099.00
2011-01-0196.0097.00
2010-12-0198.0096.00
2010-11-01101.0098.00
2010-10-01103.00101.00
2010-09-01103.00103.00
2010-08-0199.00103.00
2010-07-0199.0099.00
2010-06-01100.0099.00
2010-05-0199.00100.00
2010-04-0196.0099.00
2010-03-0193.0096.00
2010-02-0189.0093.00
2010-01-0193.0089.00
2009-12-0192.0093.00
2009-11-0189.0092.00
2009-10-0183.0089.00
2009-09-0179.0083.00
2009-08-0173.0079.00
2009-07-0165.0073.00
2009-06-0157.0065.00
2009-05-0149.0057.00
2009-04-0151.0049.00
2009-03-0145.0051.00
2009-02-0153.0045.00
2009-01-0166.0053.00
2008-12-0178.0066.00
2008-11-0179.0078.00
2008-10-0180.0079.00
2008-09-0180.0080.00
2008-08-0187.0080.00
2008-07-0188.0087.00
2008-06-0186.0088.00
2008-05-0189.0086.00
2008-04-0189.0089.00
2008-03-0191.0089.00
2008-02-0193.0091.00
2008-01-0193.0093.00
2007-12-0192.0093.00
2007-11-0194.0092.00
2007-10-0196.0094.00
2007-09-0190.0096.00
2007-08-0191.0090.00
2007-07-0187.0091.00
2007-06-0188.0087.00
2007-05-0187.0088.00
2007-04-0186.0087.00
2007-03-0185.0086.00
2007-02-0186.0085.00
2007-01-0190.0086.00
2006-12-0187.0090.00
2006-11-0185.0087.00
2006-10-0186.0085.00
2006-09-0187.0086.00
2006-08-0186.0087.00
2006-07-0188.0086.00
2006-06-0192.0088.00
2006-05-0191.0092.00
2006-04-0194.0091.00
2006-03-0192.0094.00
2006-02-0190.0092.00
2006-01-0189.0090.00
2005-12-0187.0089.00
2005-11-0188.0087.00
2005-10-0187.0088.00
2005-09-0189.0087.00
2005-08-0188.0089.00
2005-07-0187.0088.00
2005-06-0189.0087.00
2005-05-0188.0089.00
2005-04-0176.0088.00
2005-03-0173.0076.00
2005-02-0178.0073.00
2005-01-0180.0078.00
2004-12-0183.0080.00
2004-11-0182.0083.00
2004-10-0185.0082.00
2004-09-0187.0085.00
2004-08-0187.0087.00
2004-07-0192.0087.00
2004-06-0189.0092.00
2004-05-0191.0089.00
2004-04-0193.0091.00
2004-03-0192.0093.00
2004-02-0191.0092.00
2004-01-0186.0091.00
2003-12-0187.0086.00
2003-11-0187.0087.00
2003-10-0184.0087.00
2003-09-0179.0084.00
2003-08-0182.0079.00
2003-07-0180.0082.00
2003-06-0174.0080.00
2003-05-0188.0074.00
2003-04-0187.0088.00
2003-03-01087.00
21:30
API Weekly Crude Oil Stock 4,400M    
OpisThe American Petroleum Institute reports inventory levels of US crude oil, gasoline and distillates stocks. The figure shows how much oil and product is available in storage.The indicator gives an overview of US petroleum demand. If the increase in crude inventories is more than expected, it implies weaker demand and is bearish for crude prices. The same can be said if a decline in inventories is less than expected. If the increase in crude is less than expected, it implies greater demand and is bullish for crude prices. The same can be said if a decline in inventories is more than expected.
Priorytet Średni
DataPoprzednia wartośćKolejna wartośćPrzewidywana wartość
2025-11-181.300M4.400M
2025-11-126.500M1.300M1.700M
2025-11-04-4.000M6.500M-2.400M
2025-10-28-2.980M-4.000M-2.900M
2025-10-213.524M-2.980M
2025-10-162.780M3.524M0.120M
2025-10-07-3.674M2.780M2.250M
2025-09-30-3.821M-3.674M
2025-09-23-3.420M-3.821M
2025-09-161.250M-3.420M-1.600M
2025-09-090.622M1.250M
2025-09-03-0.974M0.622M-3.400M
2025-08-26-2.400M-0.974M-1.700M
2025-08-191.500M-2.400M-1.200M
2025-08-12-4.200M1.500M-0.800M
2025-08-051.539M-4.200M-1.800M
2025-07-29-0.577M1.539M-2.500M
2025-07-2219.100M-0.577M
2025-07-157.100M19.100M-2.000M
2025-07-080.680M7.100M-2.800M
2025-07-01-4.277M0.680M-2.260M
2025-06-24-10.133M-4.277M-0.600M
2025-06-17-0.370M-10.133M-0.600M
2025-06-10-3.300M-0.370M0.700M
2025-06-03-4.236M-3.300M-0.900M
2025-05-282.499M-4.236M1.000M
2025-05-204.287M2.499M-1.850M
2025-05-13-4.490M4.287M-2.400M
2025-05-063.760M-4.490M-2.500M
2025-04-29-4.565M3.760M0.390M
2025-04-222.400M-4.565M
2025-04-15-1.057M2.400M-1.680M
2025-04-086.037M-1.057M
2025-04-01-4.600M6.037M
2025-03-254.593M-4.600M-2.500M
2025-03-184.247M4.593M1.170M
2025-03-11-1.455M4.247M2.100M
2025-03-04-0.640M-1.455M-0.300M
2025-02-253.339M-0.640M2.300M
2025-02-199.043M3.339M2.200M
2025-02-115.025M9.043M2.800M
2025-02-042.860M5.025M3.170M
2025-01-281.000M2.860M3.700M
2025-01-22-2.600M1.000M
2025-01-14-4.022M-2.600M-3.500M
2025-01-07-1.442M-4.022M-0.250M
2024-12-31-3.200M-1.442M-3.000M
2024-12-24-4.700M-3.200M
2024-12-170.499M-4.700M-1.850M
2024-12-101.232M0.499M-1.300M
2024-12-03-5.935M1.232M-2.060M
2024-11-264.753M-5.935M0.250M
2024-11-19-0.777M4.753M0.800M
2024-11-133.132M-0.777M1.000M
2024-11-05-0.573M3.132M1.800M
2024-10-291.643M-0.573M2.300M
2024-10-22-1.580M1.643M0.700M
2024-10-1610.900M-1.580M3.200M
2024-10-08-1.458M10.900M1.950M
2024-10-01-4.339M-1.458M-2.100M
2024-09-241.960M-4.339M-1.100M
2024-09-17-2.790M1.960M-0.100M
2024-09-10-7.400M-2.790M0.700M
2024-09-04-3.400M-7.400M-0.900M
2024-08-270.347M-3.400M-3.000M
2024-08-20-5.205M0.347M-2.800M
2024-08-130.180M-5.205M-2.000M
2024-08-06-4.495M0.180M0.850M
2024-07-30-3.900M-4.495M
2024-07-23-4.440M-3.900M-2.470M
2024-07-16-1.923M-4.440M
2024-07-09-9.163M-1.923M-0.250M
2024-07-020.914M-9.163M-0.150M
2024-06-252.264M0.914M-3.000M
2024-06-18-2.428M2.264M
2024-06-114.052M-2.428M-1.750M
2024-06-04-6.490M4.052M-1.900M
2024-05-292.480M-6.490M-1.900M
2024-05-21-3.104M2.480M
2024-05-140.509M-3.104M-1.350M
2024-05-074.906M0.509M-1.430M
2024-04-30-3.230M4.906M-1.500M
2024-04-234.090M-3.230M1.800M
2024-04-163.034M4.090M
2024-04-09-2.286M3.034M2.415M
2024-04-029.337M-2.286M-2.000M
2024-03-26-1.519M9.337M
2024-03-19-5.521M-1.519M0.077M
2024-03-120.423M-5.521M0.400M
2024-03-058.428M0.423M2.600M
2024-02-277.168M8.428M
2024-02-218.520M7.168M4.298M
2024-02-130.674M8.520M2.600M
2024-02-06-2.500M0.674M2.133M
2024-01-30-6.674M-2.500M-0.867M
2024-01-230.483M-6.674M-3.000M
2024-01-17-5.215M0.483M-2.400M
2024-01-09-7.418M-5.215M-1.200M
2024-01-031.837M-7.418M-2.967M
2023-12-270.939M1.837M
2023-12-19-2.349M0.939M-2.233M
2023-12-120.594M-2.349M-1.500M
2023-12-05-0.817M0.594M-2.267M
2023-11-289.047M-0.817M-2.000M
2023-11-211.335M9.047M1.467M
2023-11-1411.900M1.335M1.400M
2023-11-071.347M11.900M-0.300M
2023-10-31-2.668M1.347M1.601M
2023-10-24-4.383M-2.668M1.550M
2023-10-1712.940M-4.383M-1.267M
2023-10-11-4.210M12.940M1.300M
2023-10-031.586M-4.210M-0.092M
2023-09-26-5.250M1.586M-1.650M
2023-09-191.174M-5.250M-2.667M
2023-09-12-5.521M1.174M-2.000M
2023-09-06-11.486M-5.521M-1.429M
2023-08-29-2.418M-11.486M-2.900M
2023-08-22-6.195M-2.418M-2.900M
2023-08-154.067M-6.195M-2.050M
2023-08-08-15.400M4.067M-0.233M
2023-08-011.319M-15.400M-0.900M
2023-07-25-0.797M1.319M-1.969M
2023-07-183.026M-0.797M-2.250M
2023-07-11-4.382M3.026M0.200M
2023-07-05-2.408M-4.382M-1.800M
2023-06-27-1.246M-2.408M-1.467M
2023-06-211.024M-1.246M-0.433M
2023-06-13-1.710M1.024M-1.291M
2023-06-065.202M-1.710M1.500M
2023-05-31-6.799M5.202M-1.220M
2023-05-233.690M-6.799M0.525M
2023-05-163.618M3.690M-1.300M
2023-05-09-3.939M3.618M-1.600M
2023-05-02-6.083M-3.939M-1.000M
2023-04-25-2.675M-6.083M-1.667M
2023-04-180.377M-2.675M-2.464M
2023-04-11-4.346M0.377M-1.300M
2023-04-04-6.076M-4.346M-1.800M
2023-03-283.262M-6.076M0.187M
2023-03-211.155M3.262M-1.448M
2023-03-14-3.835M1.155M0.555M
2023-03-076.203M-3.835M-0.308M
2023-02-289.895M6.203M0.440M
2023-02-2210.507M9.895M1.233M
2023-02-14-2.184M10.507M0.321M
2023-02-076.330M-2.184M2.150M
2023-01-313.378M6.330M-1.000M
2023-01-247.615M3.378M1.600M
2023-01-1814.865M7.615M-1.750M
2023-01-103.298M14.865M-2.375M
2023-01-04-1.300M3.298M
2022-12-28-3.069M-1.300M
2022-12-207.819M-3.069M-0.167M
2022-12-13-6.426M7.819M-3.913M
2022-12-06-7.850M-6.426M-3.884M
2022-11-29-4.819M-7.850M-2.487M
2022-11-22-5.835M-4.819M-2.200M
2022-11-155.618M-5.835M-0.400M
2022-11-08-6.530M5.618M1.100M
2022-11-014.520M-6.530M0.267M
2022-10-25-1.270M4.520M0.200M
2022-10-187.054M-1.270M1.551M
2022-10-12-1.770M7.054M
2022-10-044.150M-1.770M1.966M
2022-09-271.035M4.150M0.333M
2022-09-206.035M1.035M2.321M
2022-09-133.645M6.035M-0.200M
2022-09-070.593M3.645M-0.733M
2022-08-30-5.632M0.593M-0.633M
2022-08-23-0.448M-5.632M-0.450M
2022-08-162.156M-0.448M-0.117M
2022-08-092.165M2.156M0.073M
2022-08-02-4.037M2.165M-0.467M
2022-07-261.860M-4.037M-1.121M
2022-07-194.762M1.860M0.333M
2022-07-123.825M4.762M-1.933M
2022-07-06-3.799M3.825M-1.100M
2022-06-285.607M-3.799M-0.110M
2022-06-220.736M5.607M-1.433M
2022-06-141.845M0.736M-1.200M
2022-06-07-1.181M1.845M-1.800M
2022-06-010.567M-1.181M-0.067M
2022-05-24-2.445M0.567M-0.690M
2022-05-171.618M-2.445M1.533M
2022-05-10-3.479M1.618M-0.457M
2022-05-034.780M-3.479M-1.167M
2022-04-26-4.496M4.780M2.167M
2022-04-197.757M-4.496M2.533M
2022-04-121.080M7.757M1.367M
2022-04-05-3.000M1.080M-1.558M
2022-03-29-4.280M-3.000M-1.558M
2022-03-223.754M-4.280M0.025M
2022-03-152.811M3.754M-1.867M
2022-03-08-6.100M2.811M-0.833M
2022-03-015.983M-6.100M2.796M
2022-02-23-1.076M5.983M0.767M
2022-02-15-2.025M-1.076M-1.769M
2022-02-08-1.645M-2.025M0.675M
2022-02-01-0.872M-1.645M1.833M
2022-01-251.404M-0.872M-0.400M
2022-01-19-1.077M1.404M-1.367M
2022-01-11-6.432M-1.077M-1.950M
2022-01-04-3.090M-6.432M-3.400M
2021-12-28-3.670M-3.090M-3.233M
2021-12-21-0.815M-3.670M-2.633M
2021-12-14-3.089M-0.815M-2.600M
2021-12-07-0.747M-3.089M2.093M
2021-11-302.307M-0.747M-1.667M
2021-11-230.655M2.307M-0.950M
2021-11-16-2.485M0.655M1.550M
2021-11-093.594M-2.485M1.900M
2021-11-022.318M3.594M1.567M
2021-10-263.294M2.318M1.650M
2021-10-195.213M3.294M2.233M
2021-10-130.951M5.213M0.140M
2021-10-054.127M0.951M-0.300M
2021-09-28-6.108M4.127M-2.333M
2021-09-21-5.437M-6.108M-2.400M
2021-09-14-2.882M-5.437M-3.903M
2021-09-08-4.045M-2.882M-3.832M
2021-08-31-1.622M-4.045M-2.833M
2021-08-24-1.163M-1.622M-2.367M
2021-08-17-0.816M-1.163M-1.259M
2021-08-10-0.879M-0.816M-1.050M
2021-08-03-4.728M-0.879M-2.900M
2021-07-270.806M-4.728M-3.433M
2021-07-20-4.079M0.806M-4.167M
2021-07-13-7.983M-4.079M-4.333M
2021-07-07-8.153M-7.983M-3.925M
2021-06-29-7.199M-8.153M-4.460M
2021-06-22-8.537M-7.199M-3.625M
2021-06-15-2.108M-8.537M-3.000M
2021-06-08-5.360M-2.108M-3.576M
2021-06-02-0.439M-5.360M-2.114M
2021-05-250.620M-0.439M-1.279M
2021-05-18-2.533M0.620M1.680M
2021-05-11-7.688M-2.533M-2.250M
2021-05-044.319M-7.688M-2.191M
2021-04-270.436M4.319M0.375M
2021-04-20-3.608M0.436M-2.860M
2021-04-13-2.618M-3.608M-2.154M
2021-04-063.910M-2.618M-1.325M
2021-03-302.927M3.910M0.400M
2021-03-23-1.000M2.927M-0.900M
2021-03-1612.792M-1.000M2.715M
2021-03-097.356M12.792M-0.833M
2021-03-021.026M7.356M-1.850M
2021-02-23-5.800M1.026M-5.372M
2021-02-17-3.500M-5.800M-2.175M
2021-02-09-4.261M-3.500M1.340M
2021-02-02-5.272M-4.261M0.367M
2021-01-262.562M-5.272M0.603M
2021-01-20-5.821M2.562M-0.300M
2021-01-12-1.663M-5.821M-2.700M
2021-01-05-4.785M-1.663M-1.500M
2020-12-292.700M-4.785M-2.100M
2020-12-221.973M2.700M-3.250M
2020-12-151.141M1.973M-3.500M
2020-12-084.146M1.141M-1.514M
2020-12-013.800M4.146M-2.272M
2020-11-244.174M3.800M-0.333M
2020-11-17-5.147M4.174M1.950M
2020-11-10-8.010M-5.147M-0.900M
2020-11-034.577M-8.010M-0.600M
2020-10-270.584M4.577M1.200M
2020-10-20-5.422M0.584M-1.900M
2020-10-140.951M-5.422M-2.300M
2020-10-06-0.831M0.951M0.400M
2020-09-290.691M-0.831M1.400M
2020-09-22-9.517M0.691M-4.000M
2020-09-152.970M-9.517M2.049M
2020-09-09-6.360M2.970M
2020-09-01-4.524M-6.360M-1.950M
2020-08-25-4.264M-4.524M-4.300M
2020-08-18-4.400M-4.264M-2.900M
2020-08-11-8.587M-4.400M-3.200M
2020-08-04-6.829M-8.587M-3.300M
2020-07-287.544M-6.829M-1.200M
2020-07-21-8.322M7.544M-1.900M
2020-07-142.000M-8.322M-2.100M
2020-07-07-8.156M2.000M-3.700M
2020-06-301.749M-8.156M-2.700M
2020-06-233.900M1.749M0.300M
2020-06-168.400M3.900M
2020-06-09-0.500M8.400M
2020-06-028.700M-0.500M
2020-05-27-4.800M8.700M
2020-05-197.580M-4.800M2.400M
2020-05-128.400M7.580M5.000M
2020-05-0510.000M8.400M
2020-04-2813.226M10.000M
2020-04-2113.143M13.226M
2020-04-1411.938M13.143M
2020-04-0710.485M11.938M9.300M
2020-03-31-1.250M10.485M
2020-03-24-0.421M-1.250M
2020-03-176.407M-0.421M
2020-03-101.690M6.407M
2020-03-031.300M1.690M
2020-02-254.200M1.300M
23:50
Corporate Services Price Index (CSPI) (YoY) 3,0% 2,7%  
OpisThe Corporate Services Price Index (CSPI) measures the change in the price of goods sold by corporations. It is a leading indicator of consumer price inflation.A higher than expected reading should be taken as positive/bullish for the JPY, while a lower than expected reading should be taken as negative/bearish for the JPY.
PriorytetNiski
DataPoprzednia wartośćKolejna wartośćPrzewidywana wartość
2025-10-262.7%3.0%2.8%
2025-09-242.6%2.7%2.9%
2025-08-253.2%2.6%3.2%
2025-07-243.4%3.2%3.2%
2025-06-243.4%3.4%3.1%
2025-05-263.3%3.4%3.0%
2025-04-233.2%3.3%3.0%
2025-03-253.2%3.2%3.1%
2025-02-243.0%3.2%2.9%
2025-01-273.0%3.0%3.2%
2024-12-242.9%3.0%3.0%
2024-11-252.8%2.9%2.5%
2024-10-242.7%2.8%2.7%
2024-09-242.7%2.7%2.6%
2024-08-263.1%2.7%2.9%
2024-07-242.7%3.1%2.6%
2024-06-242.7%2.7%3.0%
2024-05-272.3%2.7%2.3%
2024-04-232.2%2.3%2.1%
2024-03-252.1%2.2%2.0%
2024-02-252.4%2.1%2.4%
2024-01-252.3%2.4%2.4%
2023-12-252.3%2.3%2.4%
2023-11-262.0%2.3%2.1%
2023-10-252.1%2.0%2.0%
2023-09-251.7%2.1%1.8%
2023-08-241.2%1.7%
2023-07-251.7%1.2%1.4%
2023-06-251.6%1.7%1.8%
2023-05-251.7%1.6%1.4%
2023-04-241.8%1.7%1.7%
2023-03-261.6%1.8%1.5%
2023-02-211.5%1.6%1.5%
2023-01-251.7%1.5%1.6%
2022-12-251.8%1.7%1.7%
2022-11-242.1%1.8%2.1%
2022-10-252.0%2.1%2.1%
2022-09-262.0%2.0%2.4%
2022-08-242.1%2.0%2.2%
2022-07-251.9%2.1%2.0%
2022-06-231.7%1.9%
2022-05-251.3%1.7%1.5%
2022-04-241.1%1.3%1.2%
2022-03-241.2%1.1%1.2%
2022-02-211.1%1.2%
2022-01-251.1%1.1%1.0%
2021-12-231.0%1.1%
2021-11-240.9%1.0%
2021-10-251.0%0.9%1.1%
2021-09-261.1%1.0%
2021-08-251.3%1.1%
2021-07-261.5%1.3%
2021-06-231.0%1.5%
2021-05-250.7%1.0%
2021-04-250.0%0.7%
2021-03-23-0.4%0.0%
2021-02-21-0.3%-0.4%-0.4%
2021-01-25-0.5%-0.3%-1.3%
2020-12-23-0.5%-0.5%-0.6%
2020-11-241.4%-0.5%
2020-10-251.1%1.4%1.0%
2020-09-241.1%1.1%
2020-08-250.9%1.1%
2020-07-270.5%0.9%
2020-06-230.8%0.5%
2020-05-251.6%0.8%
2020-04-232.1%1.6%
2020-03-252.3%2.1%
2020-02-242.1%2.3%
2020-01-272.1%2.1%
2019-12-242.1%2.1%
2019-11-250.5%2.1%
2019-10-170.6%0.5%0.6%
2019-09-240.6%0.6%0.5%
2019-08-260.7%0.6%
2019-07-240.9%0.7%0.8%
2019-06-241.0%0.9%1.1%
2019-05-271.1%1.0%1.2%
2019-04-231.1%1.1%1.1%
2019-03-251.0%1.1%1.2%
2019-02-241.1%1.0%1.1%
2019-01-271.2%1.1%1.2%
2018-12-241.3%1.2%1.3%
2018-11-261.1%1.3%1.2%
2018-10-241.3%1.1%1.2%
2018-09-241.1%1.3%1.1%
2018-08-231.1%1.1%1.2%
2018-07-251.0%1.1%1.0%
2018-06-251.0%1.0%1.0%
2018-05-270.5%1.0%0.5%
2018-04-230.7%0.5%0.5%
2018-03-260.7%0.7%0.7%
2018-02-220.8%0.7%0.8%
2018-01-250.8%0.8%0.8%
2017-12-250.8%0.8%0.8%
2017-11-260.9%0.8%0.9%
2017-10-250.8%0.9%0.9%
2017-09-250.6%0.8%0.7%
2017-08-240.7%0.6%0.8%
2017-07-250.8%0.7%0.8%
2017-06-250.8%0.8%0.7%
2017-05-250.8%0.8%0.9%
2017-04-240.8%0.8%0.8%
2017-03-260.5%0.8%0.5%
2017-02-220.5%0.5%0.4%
2017-01-250.3%0.5%0.4%
2016-12-250.5%0.3%0.5%
2016-11-240.2%0.5%0.3%
2016-10-250.2%0.2%0.2%
2016-09-260.3%0.2%0.3%
2016-08-240.2%0.3%0.1%
2016-07-250.2%0.2%0.1%
2016-06-230.3%0.2%0.1%
2016-05-250.2%0.3%0.2%
2016-04-240.2%0.2%0.2%
2016-03-240.3%0.2%
2016-02-230.4%0.3%0.3%
2016-01-250.2%0.4%0.2%
2015-12-240.4%0.2%0.4%
2015-11-240.5%0.4%0.6%
2015-10-260.8%0.5%0.6%
2015-09-240.6%0.8%0.5%
2015-08-250.4%0.6%0.4%
2015-07-260.6%0.4%0.6%
2015-06-230.7%0.6%0.4%
2015-05-253.1%0.7%0.6%
2015-04-233.3%3.1%3.3%
2015-03-243.5%3.3%3.3%
2015-02-233.5%3.5%3.6%
2015-01-263.6%3.5%3.6%
2014-12-243.6%3.6%3.5%
2014-11-243.5%3.6%3.6%
2014-10-263.5%3.5%3.5%
2014-09-243.4%3.5%3.7%
2014-08-253.7%3.4%3.7%
2014-07-233.6%3.7%3.6%
2014-06-243.4%3.6%3.2%
2014-05-260.7%3.4%3.3%
2014-04-230.7%0.7%0.8%
2014-03-250.7%0.7%0.8%
2014-02-241.1%0.7%1.2%
2014-01-271.2%1.1%1.1%
2013-12-240.8%1.2%0.8%
2013-11-250.7%0.8%0.9%
2013-10-240.7%0.7%0.8%
2013-09-240.6%0.7%0.5%
2013-08-250.4%0.6%0.4%
2013-07-240.3%0.4%0.7%
2013-06-24-0.3%0.3%0.1%
2013-05-27-0.2%-0.3%-0.2%
2013-04-230.0%-0.2%-0.4%
2013-03-25-0.2%0.0%0.0%
2013-02-24-0.4%-0.2%-0.2%
2013-01-27-0.5%-0.4%-0.5%
2012-12-24-0.7%-0.5%-0.6%
2012-11-26-0.5%-0.7%-0.6%
2012-10-24-0.3%-0.5%-0.4%
2012-09-24-0.3%-0.3%-0.2%
2012-08-23-0.4%-0.3%-0.2%
2012-07-250.1%-0.4%0.0%
2012-06-250.2%0.1%0.3%
2012-05-27-0.2%0.2%-0.1%
2012-04-23-0.6%-0.2%-0.6%
2012-03-26-0.4%-0.6%-0.4%
2012-02-230.1%-0.4%0.1%
2012-01-25-0.1%0.1%0.0%
2011-12-260.1%-0.1%0.1%
2011-11-240.0%0.1%0.0%
2011-10-25-0.4%0.0%-0.4%
2011-09-26-0.3%-0.4%-0.4%
2011-08-23-0.8%-0.3%-0.5%
2011-07-25-0.9%-0.8%-0.9%
2011-06-23-0.7%-0.9%-0.8%
2011-05-25-1.2%-0.7%-1.0%
2011-04-24-1.1%-1.2%-1.1%
2011-03-24-1.1%-1.1%-1.1%
2011-02-22-1.3%-1.1%-1.3%
2011-01-25-1.1%-1.3%-1.3%
2010-12-26-1.3%-1.1%-1.1%
2010-11-24-1.1%-1.3%-1.1%
2010-10-25-1.1%-1.1%-1.0%
2010-09-26-1.1%-1.1%-1.2%
2010-08-24-1.0%-1.1%-0.9%
2010-07-26-0.8%-1.0%-0.9%
2010-06-23-1.1%-0.8%-1.0%
2010-05-25-1.2%-1.1%
2010-04-25-1.2%-1.2%-1.3%
2010-03-24-1.2%-1.2%-1.0%
2010-02-23-1.5%-1.2%-1.1%
2010-01-25-2.2%-1.5%-1.4%
2009-12-24-2.3%-2.2%-1.9%
2009-11-24-3.2%-2.3%-2.5%
2009-10-28-3.5%-3.2%-3.3%
2009-09-24-3.4%-3.5%-3.5%
2009-08-25-3.2%-3.4%-3.3%
2009-07-26-3.0%-3.2%-3.2%
2009-06-23-2.4%-3.0%-2.8%
2009-05-25-2.1%-2.4%-2.3%
2009-04-23-2.6%-2.1%-2.6%
2009-03-25-2.2%-2.6%-2.5%
2009-02-23-2.5%-2.2%-2.5%
2009-01-26-1.9%-2.5%-2.4%
2008-12-24-1.4%-1.9%-1.9%
2008-11-240.1%-1.4%-0.5%
2008-10-261.4%0.1%1.2%
2008-09-241.3%1.4%1.2%
2008-08-251.2%1.3%1.4%
2008-07-240.6%1.2%0.6%
2008-06-240.5%0.6%0.5%
2008-05-270.6%0.5%0.4%
2008-04-230.7%0.6%0.7%
2008-03-250.8%0.7%0.7%
2008-02-2400.8%1.4%

Kalendarz ekonomiczny to niezbędne narzędzie tradera na Forexie aktualizowane w czasie rzeczywistym. Zawiera informacje o najważniejszych wskaźnikach makroekonomicznych oraz wydarzeniach mających wpływ na dany instrument handlowy. Kalendarz ekonomiczny jest przydatny dla tych traderów, których strategia oparta jest o analizę fundamentalną. Dzięki pomocy kalendarza klienci LiteForexu zawsze będą na bieżąco, co sprawi, że ich działalność na Forexie będzie bardziej stabilna i efektywna.

Materiały publikowane na tej stronie zostały udostępnione przez brokera LiteForex wyłącznie w celach informacyjnych i nie mogą być traktowane jako porada inwestycyjna ani konsultacja w rozumieniu dyrektywy 2014/65/UE. Ponadto materiały te nie zostały przygotowane zgodnie z wymogami prawnymi, wspierającymi niezależność badań inwestycyjnych i nie podlegają żadnym ograniczeniom dotyczącym ich dalszego rozpowszechniania.

Analizy forex profesjonalistów

24.11.2025 11:43
Prognoza cen srebra: kurs XAGUSD na rok 2025 oraz kolejne lata
Napisano Jana Kane

Szczegółowa prognoza wiodących analityków oraz ekspertów cen XAGUSD na lata 2025-2030.

2997847
24.11.2025 09:50
Prognoza euro/dolar: kurs EUR/USD na lata 2025, 2026–2027 oraz kolejne
Napisano Jana Kane

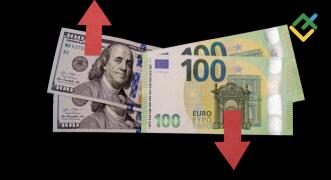
W artykule przedstawiono krótko- i długoterminowe prognozy kursu euro w stosunku do dolara amerykańs...

10785450
24.11.2025 09:49
Prognoza & Przewidywania dla cen złota: rok 2025, 2026, 2027-2030 i lata późniejsze
Napisano Jana Kane

Co stanie się z ceną złota w przyszłości? Analizujemy czynniki fundamentalne i techniczne oraz ich p...

37880483
24.11.2025 09:42
Prognoza cen ropy naftowej na lata 2025, 2026, 2027-2030: przegląd dla WTI i Brent
Napisano Jana Kane

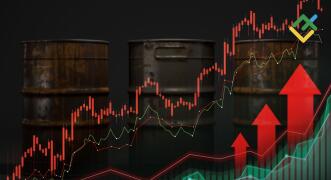
Prognozy ekspertów dotyczące ropy naftowej WTI i Brent na najbliższy czas oraz długoterminową perspe...

5907227
21.11.2025 12:46
Prognoza S&P 500: kurs indeksu SPX na lata 2025, 2026, 2027–2030 oraz kolejne
Napisano Jana Kane

Analiza i prognozy dla S&P 500 na lata 2025-2026 oraz w perspektywie długoterminowej.

1767427
18.11.2025 16:40
Prognoza kursu USDCAD na lata 2024, 2025, 2026-2030 oraz kolejne
Napisano Jana Kane

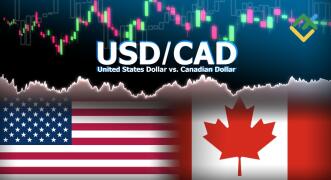
W artykule przedstawiono prognozy dotyczące dalszej dynamiki notowań pary walutowej USDCAD na lata 2...

Zobacz wszystkie
Śledź nas w sieciach społecznościowych!
Live Chat