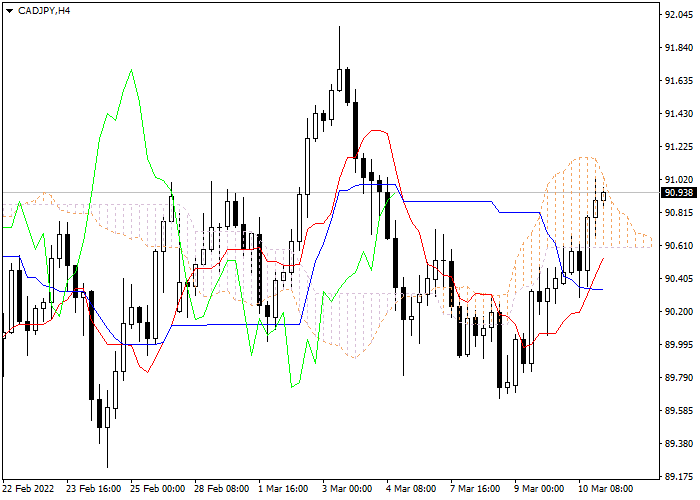
Let's look at the four-hour chart. Tenkan-sen line is above Kijun-sen, the red line is directed upwards, while the blue one remains horizontal. Confirmative line Chikou Span has crossed the price chart from below, current cloud is ascending. The instrument has entered the cloud. The closest support level is the lower border of the cloud (90.54). The closest resistance level is the lower border of the cloud (91.17).
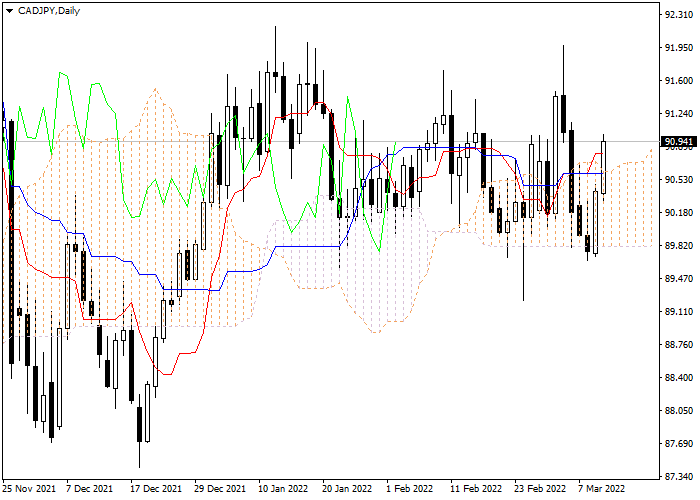
On the daily chart Tenkan-sen line is above Kijun-sen, the lines are horizontal . Confirmative line Chikou Span has crossed the price chart from below, current cloud is ascending. The instrument has broken through the cloud and is still rising. The closest support level is Tenkan-sen line (89.80). The closest resistance level is Tenkan-sen line (92.29).
It is not recommended to open positions at current price. Pending orders should be placed at the cloud’s borders: sell at the level of 90.54, with Take Profit at 88.90 and Stop Loss at 91.17; buy at the level of 91.17, with Take Profit at 92.90 and Stop Loss at 90.54.
Canadian Dollar to Japanese Yen
| Kupowanie | Sprzedaż | Spread |
| 114.022 | 114.009 | 13 |
Scenariusz
| Przedział czasowy | Zakres dzienny |
| Rekomendacje | BUY STOP |
| Punkt wejścia | 91.17 |
| Take Profit | 92.90 |
| Stop Loss | 90.54 |
| Poziomy kluczowe | 89.80, 90.54, 91.17, 92.29 |
Scenariusz alternatywny
| Rekomendacje | SELL STOP |
| Punkt wejścia | 90.54 |
| Take Profit | 88.90 |
| Stop Loss | 91.17 |
| Poziomy kluczowe | 89.80, 90.54, 91.17, 92.29 |
Materiały publikowane na tej stronie zostały zaprezentowane przez firmę Claws&Horns we współpracy z LiteForex wyłącznie w celach informacyjnych i nie mogą być uznawane za poradę inwestycyjną ani konsultację w rozumieniu dyrektywy 2014/65/UE. Ponadto materiały te nie zostały przygotowane zgodnie z wymogami prawnymi wspierającymi niezależność badań inwestycyjnych i nie podlegają żadnym ograniczeniom dotyczącym zawierania transakcji przed ich rozpowszechnieniem.